Program started at Mon-03-Oct-2005 16:29. Analysed requests from Tue-01-Feb-2005 00:00 to Sun-02-Oct-2005 23:00 (243.96 days). (Go To: Top: General Summary: Monthly Report: Daily Summary: Hourly Summary: Organisation Report: Status Code Report: File Size Report: File Type Report: Directory Report) General SummaryThis report contains overall statistics. (Figures in parentheses refer to the 7-day period ending 03-Oct-2005 16:29).
Monthly ReportThis report lists the activity in each month.
Each unit ( month: reqs: %reqs: pages: %pages: Pbytes: %bytes: --------: --------: ------: -------: ------: ------: ------: Feb 2005: 10583351: 7.02%: 978689: 8.89%: 1.10: 17.69%:Busiest month: Aug 2005 (2,430,554 requests for pages). Daily SummaryThis report lists the total activity for each day of the week, summed over all the weeks in the report.
Each unit ( day: reqs: %reqs: pages: %pages: Pbytes: %bytes: ---: --------: ------: -------: ------: ------: ------: Sun: 20764673: 13.77%: 1426608: 12.96%: 0.97: 15.66%: Hourly SummaryThis report lists the total activity for each hour of the day, summed over all the days in the report.
Each unit ( hour: reqs: %reqs: pages: %pages: Tbytes: %bytes: ----: -------: ------: ------: ------: ------: ------: 0: 3908808: 2.59%: 423208: 3.84%: 120.18: 1.89%: Organisation ReportThis report lists the organisations of the computers which requested files.
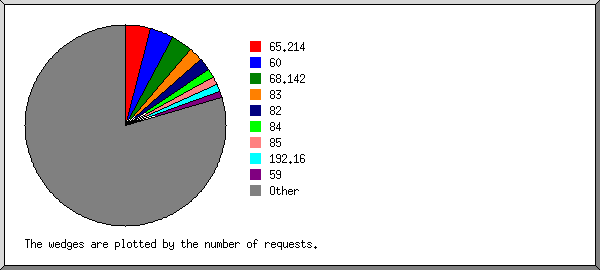
Listing the top 20 organisations by the number of requests, sorted by the number of requests. reqs: %bytes: organisation ---------: ------: ------------ 6096895: 0.01%: 65.214 5807741: 6.21%: 60 5332114: : 68.142 3420583: 1.20%: 83 3045288: 0.58%: 82 2058384: 0.41%: 84 2025923: 0.34%: 85 1641702: : 192.16 1576885: 0.70%: 59 972782: 0.20%: 69 709715: 0.03%: 58 706179: 0.67%: 222.90 661806: : 80.64 605171: 0.14%: 70 533837: 0.03%: 64.12 531622: 0.49%: 218.19 528976: 1.10%: 218.28 515729: 0.58%: 219.140 509343: 0.04%: 213.114 500904: 0.56%: 221.232 112965115: 86.72%: [not listed: 12,972 organisations] Status Code ReportThis report lists the HTTP status codes of all requests.
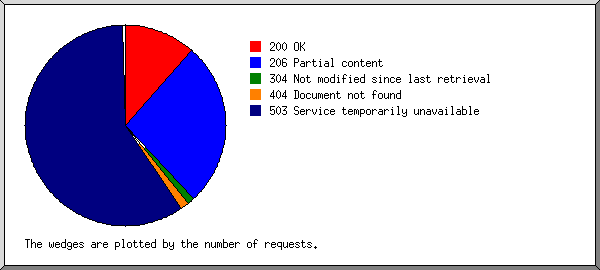
Listing status codes, sorted numerically. reqs: status code
---------: -----------
44687698: 200 OK
101729811: 206 Partial content
1039017: 301 Document moved permanently
6148: 302 Document found elsewhere
4329185: 304 Not modified since last retrieval
15820: 400 Bad request
6: 401 Authentication required
79391: 403 Access forbidden
5249943: 404 Document not found
8505: 405 Method not allowed
46: 406 Document not acceptable to client
4: 412 Precondition failed
11: 414 Requested filename too long
462214: 416 Requested range not valid
480: 500 Internal server error
1196: 501 Request type not supported
227044186: 503 Service temporarily unavailable
File Size ReportThis report lists the sizes of files.
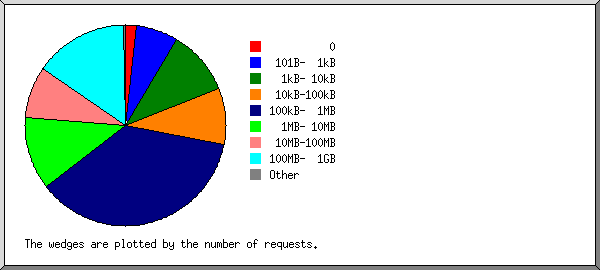
       size:     reqs: %bytes:
-----------: --------: ------:
          0:  2881062:       :
   1B-  10B:    20553:       :
  11B- 100B:   445114:       :
 101B-  1kB: 10111581:       :
  1kB- 10kB: 15805715:       :
 10kB-100kB: 13668200:  0.01%:
100kB-  1MB: 54615977:  0.29%:
  1MB- 10MB: 17893529:  0.85%:
 10MB-100MB: 12484148:  7.56%:
100MB-  1GB: 22819318: 91.25%:
      > 1GB:     1497:  0.03%:
File Type ReportThis report lists the extensions of files.
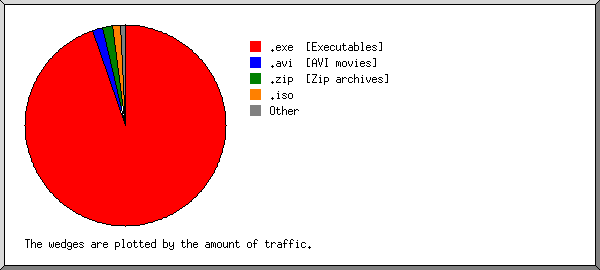
Listing extensions with at least 0.1% of the traffic, sorted by the amount of traffic. reqs: %bytes: extension --------: ------: --------- 88706146: 94.65%: .exe [Executables] 13461247: 1.81%: .avi [AVI movies] 4175146: 1.60%: .zip [Zip archives] 693729: 1.25%: .iso 1703670: 0.34%: .zip [Zip archives] 347469: 0.12%: .mpg [MPEG movie] 41659287: 0.24%: [not listed: 9,935 extensions] Directory ReportThis report lists the directories from which files were requested. (The figures for each directory include all of its subdirectories.)
Listing directories with at least 0.01% of the traffic, sorted by the amount of traffic. reqs: %bytes: directory ---------: ------: --------- 136355268: 99.99%: /pub/ 14391426: 0.01%: [not listed: 50 directories] This analysis was produced by analog 6.0. Running time: 128 minutes, 23 seconds. (Go To: Top: General Summary: Monthly Report: Daily Summary: Hourly Summary: Organisation Report: Status Code Report: File Size Report: File Type Report: Directory Report) |
 ) represents 200,000 requests for pages or part thereof.

 Apr 2005: 14857104: 9.86%: 1219285: 11.08%: 1.85: 29.90%:
