Program started at Mon-03-Oct-2005 18:07. Analysed requests from Tue-01-Mar-2005 00:00 to Thu-31-Mar-2005 23:59 (31.00 days). (Go To: Top: General Summary: Monthly Report: Daily Summary: Hourly Summary: Organisation Report: Status Code Report: File Size Report: File Type Report: Directory Report) General SummaryThis report contains overall statistics. (Figures in parentheses refer to the 7-day period ending 31-Mar-2005 23:59).
Monthly ReportThis report lists the activity in each month.
Each unit ( month: reqs: %reqs: pages: %pages: Pbytes: %bytes: --------: --------: ------: -------: ------: ------: ------: Mar 2005: 21724760: 100%: 1519372: 100%: 2.61: 100%:Busiest month: Mar 2005 (1,519,372 requests for pages). Daily SummaryThis report lists the total activity for each day of the week, summed over all the weeks in the report.
Each unit ( day: reqs: %reqs: pages: %pages: Tbytes: %bytes: ---: -------: ------: ------: ------: ------: ------: Sun: 3094808: 14.25%: 178735: 11.76%: 412.19: 15.42%: Hourly SummaryThis report lists the total activity for each hour of the day, summed over all the days in the report.
Each unit ( hour: reqs: %reqs: pages: %pages: Tbytes: %bytes: ----: -------: ------: ------: ------: ------: ------: 0: 576459: 2.65%: 55234: 3.64%: 54.17: 2.03%: Organisation ReportThis report lists the organisations of the computers which requested files.
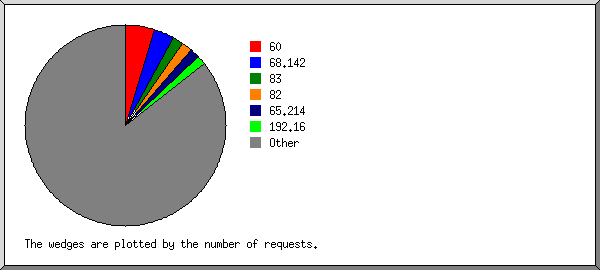
Listing the top 20 organisations by the number of requests, sorted by the number of requests. reqs: %bytes: organisation --------: ------: ------------ 1030207: 7.11%: 60 703639: : 68.142 403244: 0.59%: 83 357924: 0.39%: 82 348451: : 65.214 313722: : 192.16 195179: : 66.196 189327: 0.17%: 84 186400: 0.17%: 85 185213: 1.28%: 218.28 139618: 1.06%: 218.14 138902: 1.05%: 218.24 128417: 0.01%: 81.227 126645: 0.94%: 218.13 115283: 0.84%: 218.61 102616: 0.87%: 221.201 102037: 0.72%: 219.130 97952: 0.69%: 222.90 95734: 0.03%: 213.114 92155: 0.73%: 218.12 16672095: 83.35%: [not listed: 11,171 organisations] Status Code ReportThis report lists the HTTP status codes of all requests.
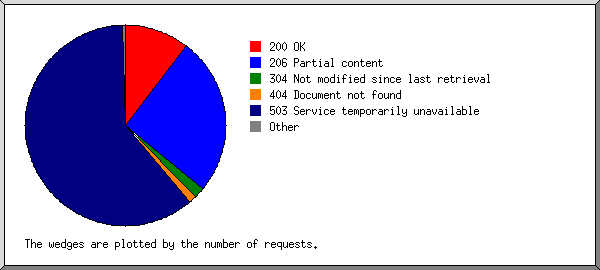
Listing status codes, sorted numerically. reqs: status code
--------: -----------
6046045: 200 OK
14753312: 206 Partial content
132010: 301 Document moved permanently
1199: 302 Document found elsewhere
925403: 304 Not modified since last retrieval
2564: 400 Bad request
4: 401 Authentication required
20754: 403 Access forbidden
711409: 404 Document not found
1558: 405 Method not allowed
3: 406 Document not acceptable to client
2: 414 Requested filename too long
68499: 416 Requested range not valid
60: 500 Internal server error
603: 501 Request type not supported
35104871: 503 Service temporarily unavailable
File Size ReportThis report lists the sizes of files.
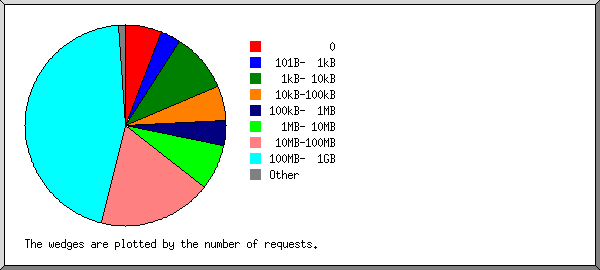
       size:    reqs: %bytes:
-----------: -------: ------:
          0: 1283788:       :
   1B-  10B:    9818:       :
  11B- 100B:  214474:       :
 101B-  1kB:  708851:       :
  1kB- 10kB: 2078493:       :
 10kB-100kB: 1199976:       :
100kB-  1MB:  881495:  0.01%:
  1MB- 10MB: 1588048:  0.26%:
 10MB-100MB: 3928916:  6.11%:
100MB-  1GB: 9830779: 93.61%:
      > 1GB:     122:  0.01%:
File Type ReportThis report lists the extensions of files.
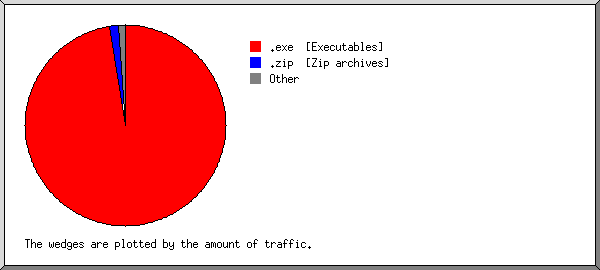
Listing extensions with at least 0.1% of the traffic, sorted by the amount of traffic. reqs: %bytes: extension --------: ------: --------- 14700136: 97.49%: .exe [Executables] 875627: 1.41%: .zip [Zip archives] 105744: 0.88%: .iso 6043253: 0.23%: [not listed: 2,934 extensions] Directory ReportThis report lists the directories from which files were requested. (The figures for each directory include all of its subdirectories.)
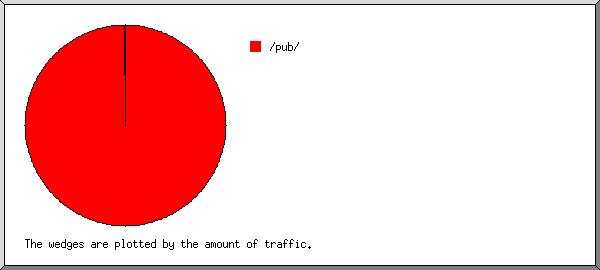
Listing directories with at least 0.01% of the traffic, sorted by the amount of traffic. reqs: %bytes: directory --------: ------: --------- 19251453: 99.99%: /pub/ 2473307: 0.01%: [not listed: 36 directories] This analysis was produced by analog 6.0. Running time: 15 minutes, 42 seconds. (Go To: Top: General Summary: Monthly Report: Daily Summary: Hourly Summary: Organisation Report: Status Code Report: File Size Report: File Type Report: Directory Report) |
 ) represents 150,000 requests for pages or part thereof.


 Wed: 3401900: 15.66%: 276289: 18.18%: 392.96: 14.70%: