Program started at Mon-03-Oct-2005 18:23. Analysed requests from Fri-01-Apr-2005 00:00 to Sat-30-Apr-2005 23:59 (30.00 days). (Go To: Top: General Summary: Monthly Report: Daily Summary: Hourly Summary: Organisation Report: Status Code Report: File Size Report: File Type Report: Directory Report) General SummaryThis report contains overall statistics. (Figures in parentheses refer to the 7-day period ending 30-Apr-2005 23:59).
Monthly ReportThis report lists the activity in each month.
Each unit ( month: reqs: %reqs: pages: %pages: Pbytes: %bytes: --------: --------: ------: -------: ------: ------: ------: Apr 2005: 14857104: 100%: 1219285: 100%: 1.85: 100%:Busiest month: Apr 2005 (1,219,285 requests for pages). Daily SummaryThis report lists the total activity for each day of the week, summed over all the weeks in the report.
Each unit ( day: reqs: %reqs: pages: %pages: Tbytes: %bytes: ---: -------: ------: ------: ------: ------: ------: Sun: 2205708: 14.85%: 163602: 13.42%: 294.97: 15.53%: Hourly SummaryThis report lists the total activity for each hour of the day, summed over all the days in the report.
Each unit ( hour: reqs: %reqs: pages: %pages: Tbytes: %bytes: ----: ------: ------: ------: ------: ------: ------: 0: 336908: 2.27%: 45380: 3.72%: 28.97: 1.53%: Organisation ReportThis report lists the organisations of the computers which requested files.
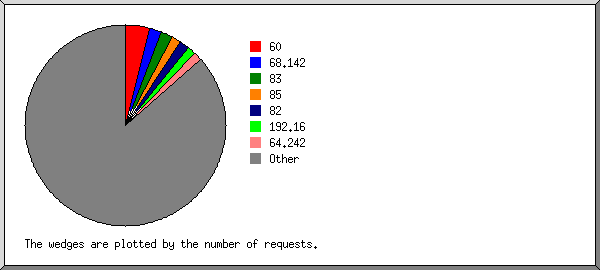
Listing the top 20 organisations by the number of requests, sorted by the number of requests. reqs: %bytes: organisation --------: ------: ------------ 586597: 6.04%: 60 301602: : 68.142 275225: 0.66%: 83 226486: 0.25%: 85 225136: 0.30%: 82 213016: : 192.16 187361: 0.01%: 64.242 147230: 0.17%: 84 116291: : 65.214 104172: : 80.64 101096: : 171.64 96888: 1.04%: 218.28 95889: 0.96%: 219.140 93927: 0.94%: 222.90 92727: 0.86%: 59 91980: : 66.196 87475: 0.89%: 221.232 82087: 0.74%: 219.137 80144: 0.93%: 219.144 72841: 0.02%: 81.229 11578934: 86.20%: [not listed: 10,684 organisations] Status Code ReportThis report lists the HTTP status codes of all requests.
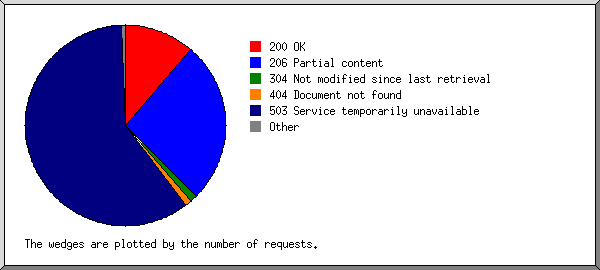
Listing status codes, sorted numerically. reqs: status code
--------: -----------
4388677: 200 OK
10050838: 206 Partial content
77243: 301 Document moved permanently
693: 302 Document found elsewhere
417589: 304 Not modified since last retrieval
680: 400 Bad request
2: 401 Authentication required
9230: 403 Access forbidden
451309: 404 Document not found
939: 405 Method not allowed
7: 406 Document not acceptable to client
1: 412 Precondition failed
3: 414 Requested filename too long
100920: 416 Requested range not valid
214: 500 Internal server error
48: 501 Request type not supported
23059809: 503 Service temporarily unavailable
File Size ReportThis report lists the sizes of files.
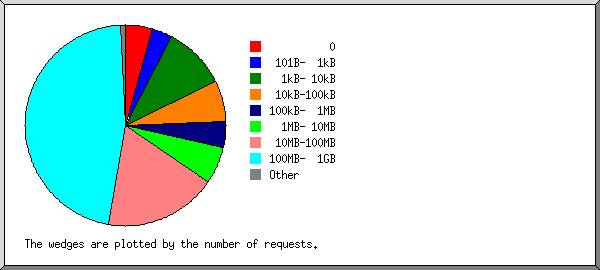
       size:    reqs: %bytes:
-----------: -------: ------:
          0:  660252:       :
   1B-  10B:    2769:       :
  11B- 100B:  101218:       :
 101B-  1kB:  478859:       :
  1kB- 10kB: 1517485:       :
 10kB-100kB:  985472:       :
100kB-  1MB:  599300:  0.01%:
  1MB- 10MB:  902005:  0.21%:
 10MB-100MB: 2679898:  6.31%:
100MB-  1GB: 6929685: 93.46%:
      > 1GB:     161:  0.01%:
File Type ReportThis report lists the extensions of files.
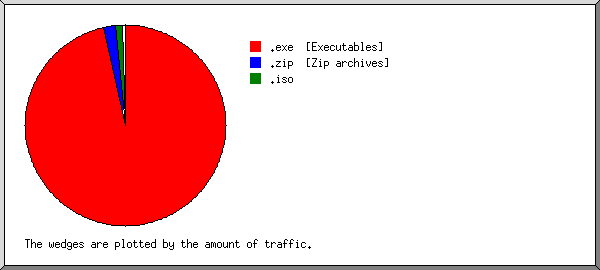
Listing extensions with at least 0.1% of the traffic, sorted by the amount of traffic. reqs: %bytes: extension -------: ------: --------- 9956976: 96.59%: .exe [Executables] 468007: 1.83%: .zip [Zip archives] 97817: 1.11%: .iso 87150: 0.22%: .zip [Zip archives] 4247154: 0.26%: [not listed: 3,217 extensions] Directory ReportThis report lists the directories from which files were requested. (The figures for each directory include all of its subdirectories.)
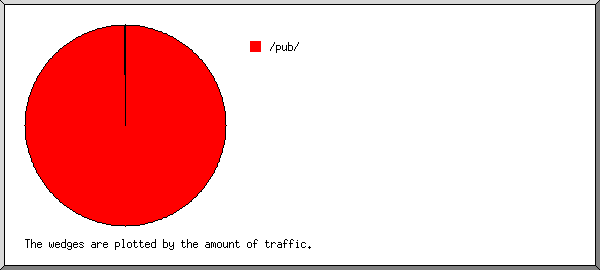
Listing directories with at least 0.01% of the traffic, sorted by the amount of traffic. reqs: %bytes: directory --------: ------: --------- 13291140: 99.99%: /pub/ 1565964: 0.01%: [not listed: 31 directories] This analysis was produced by analog 6.0. Running time: 9 minutes, 57 seconds. (Go To: Top: General Summary: Monthly Report: Daily Summary: Hourly Summary: Organisation Report: Status Code Report: File Size Report: File Type Report: Directory Report) |
 ) represents 100,000 requests for pages or part thereof.


