Program started at Mon-03-Oct-2005 18:33. Analysed requests from Sun-01-May-2005 00:00 to Tue-31-May-2005 23:59 (31.00 days). (Go To: Top: General Summary: Monthly Report: Daily Summary: Hourly Summary: Organisation Report: Status Code Report: File Size Report: File Type Report: Directory Report) General SummaryThis report contains overall statistics. (Figures in parentheses refer to the 7-day period ending 31-May-2005 23:59).
Monthly ReportThis report lists the activity in each month.
Each unit ( month: reqs: %reqs: pages: %pages: Tbytes: %bytes: --------: -------: ------: ------: ------: ------: ------: May 2005: 8705980: 100%: 618356: 100%: 334.72: 100%:Busiest month: May 2005 (618,356 requests for pages). Daily SummaryThis report lists the total activity for each day of the week, summed over all the weeks in the report.
Each unit ( day: reqs: %reqs: pages: %pages: Tbytes: %bytes: ---: -------: ------: ------: ------: ------: ------: Sun: 1217246: 13.98%: 81801: 13.23%: 46.80: 13.98%: Hourly SummaryThis report lists the total activity for each hour of the day, summed over all the days in the report.
Each unit ( hour: reqs: %reqs: pages: %pages: Tbytes: %bytes: ----: ------: ------: -----: ------: ------: ------: 0: 215880: 2.48%: 30291: 4.90%: 6.15: 1.84%: Organisation ReportThis report lists the organisations of the computers which requested files.
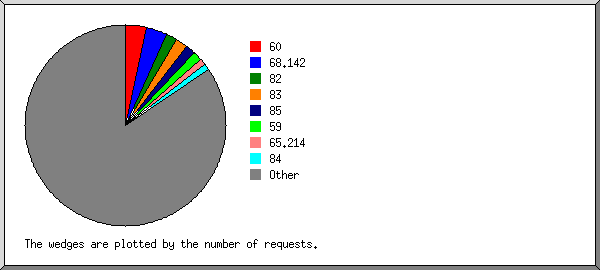
Listing the top 20 organisations by the number of requests, sorted by the number of requests. reqs: %bytes: organisation -------: ------: ------------ 306395: 6.44%: 60 287638: : 68.142 163180: 0.75%: 82 162918: 0.79%: 83 141236: 0.29%: 85 119257: 1.52%: 59 92852: : 65.214 90324: 0.36%: 84 58648: 0.01%: 217.113 58216: 0.63%: 221.232 57626: 0.01%: 66.183 55813: : 192.16 55263: : 80.64 54127: 0.77%: 222.90 53821: 0.01%: 81.227 47167: 0.60%: 219.140 46251: 0.70%: 218.19 42770: 0.37%: 219.137 41699: 0.56%: 220.173 40765: 0.50%: 61.144 6730014: 85.69%: [not listed: 10,222 organisations] Status Code ReportThis report lists the HTTP status codes of all requests.
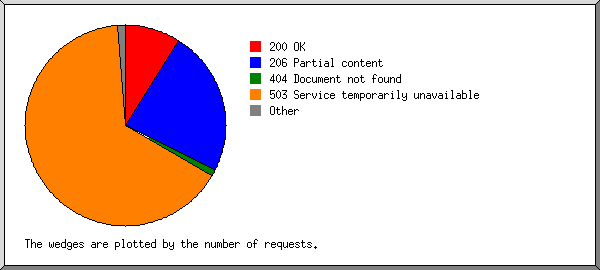
Listing status codes, sorted numerically. reqs: status code
--------: -----------
2337936: 200 OK
6129482: 206 Partial content
45306: 301 Document moved permanently
327: 302 Document found elsewhere
238562: 304 Not modified since last retrieval
635: 400 Bad request
4348: 403 Access forbidden
286928: 404 Document not found
611: 405 Method not allowed
1: 406 Document not acceptable to client
29194: 416 Requested range not valid
7: 500 Internal server error
290: 501 Request type not supported
17101081: 503 Service temporarily unavailable
File Size ReportThis report lists the sizes of files.
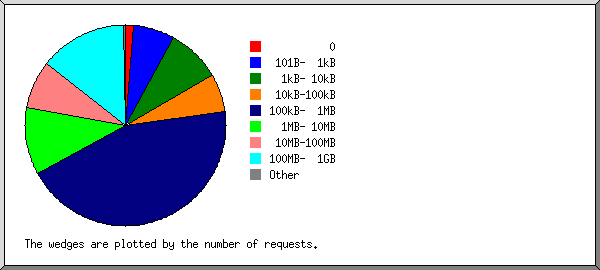
       size:    reqs: %bytes:
-----------: -------: ------:
          0:  116297:       :
   1B-  10B:     481:       :
  11B- 100B:   15635:       :
 101B-  1kB:  581582:       :
  1kB- 10kB:  761559:       :
 10kB-100kB:  530298:       :
100kB-  1MB: 3845263:  0.38%:
  1MB- 10MB:  940838:  0.79%:
 10MB-100MB:  678321:  8.28%:
100MB-  1GB: 1235636: 90.51%:
      > 1GB:      70:  0.03%:
File Type ReportThis report lists the extensions of files.
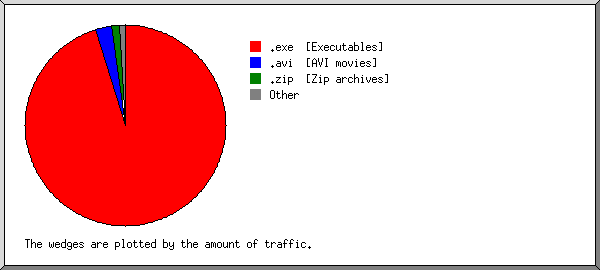
Listing extensions with at least 0.1% of the traffic, sorted by the amount of traffic. reqs: %bytes: extension -------: ------: --------- 5806450: 95.24%: .exe [Executables] 431684: 2.56%: .avi [AVI movies] 269077: 1.34%: .zip [Zip archives] 24129: 0.54%: .iso 2174640: 0.32%: [not listed: 2,622 extensions] Directory ReportThis report lists the directories from which files were requested. (The figures for each directory include all of its subdirectories.)
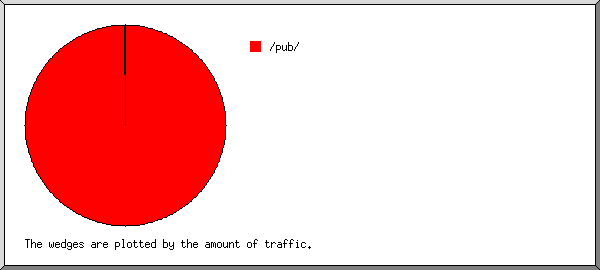
Listing directories with at least 0.01% of the traffic, sorted by the amount of traffic. reqs: %bytes: directory -------: ------: --------- 7804172: 99.99%: /pub/ 901808: 0.01%: [not listed: 29 directories] This analysis was produced by analog 6.0. Running time: 6 minutes, 7 seconds. (Go To: Top: General Summary: Monthly Report: Daily Summary: Hourly Summary: Organisation Report: Status Code Report: File Size Report: File Type Report: Directory Report) |
 ) represents 50,000 requests for pages or part thereof.


