Program started at Mon-03-Oct-2005 18:39. Analysed requests from Wed-01-Jun-2005 00:00 to Thu-30-Jun-2005 23:59 (30.00 days). (Go To: Top: General Summary: Monthly Report: Daily Summary: Hourly Summary: Organisation Report: Status Code Report: File Size Report: File Type Report: Directory Report) General SummaryThis report contains overall statistics. (Figures in parentheses refer to the 7-day period ending 30-Jun-2005 23:59).
Monthly ReportThis report lists the activity in each month.
Each unit ( month: reqs: %reqs: pages: %pages: Tbytes: %bytes: --------: --------: ------: ------: ------: ------: ------: Jun 2005: 10360562: 100%: 619397: 100%: 38.59: 100%:Busiest month: Jun 2005 (619,397 requests for pages). Daily SummaryThis report lists the total activity for each day of the week, summed over all the weeks in the report.
Each unit ( day: reqs: %reqs: pages: %pages: Tbytes: %bytes: ---: -------: ------: ------: ------: ------: ------: Sun: 1402582: 13.54%: 79002: 12.75%: 4.87: 12.61%: Hourly SummaryThis report lists the total activity for each hour of the day, summed over all the days in the report.
Each unit ( hour: reqs: %reqs: pages: %pages: Tbytes: %bytes: ----: ------: ------: -----: ------: ------: ------: 0: 303356: 2.93%: 24822: 4.01%: 1.33: 3.46%: Organisation ReportThis report lists the organisations of the computers which requested files.
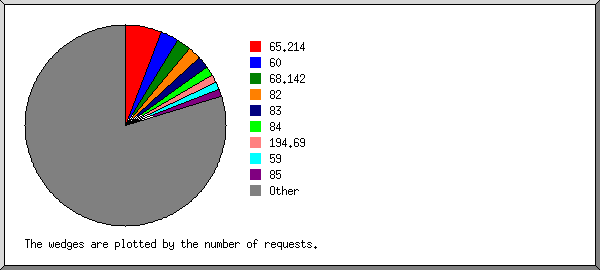
Listing the top 20 organisations by the number of requests, sorted by the number of requests. reqs: %bytes: organisation -------: ------: ------------ 611379: 0.07%: 65.214 306996: 1.42%: 60 242170: 0.01%: 68.142 213940: 4.09%: 82 196161: 4.18%: 83 163835: 4.21%: 84 129712: 0.11%: 194.69 124787: 0.85%: 59 121613: 2.13%: 85 92807: 2.14%: 69 62384: 0.05%: 192.16 55544: 0.08%: 222.90 55227: 0.08%: 221.232 52334: 0.07%: 61.144 47810: 1.36%: 70 47163: 0.08%: 218.19 46524: 0.07%: 219.140 45588: 0.08%: 220.173 43471: 0.38%: 212.138 42064: 0.05%: 218.89 7659053: 78.50%: [not listed: 10,442 organisations] Status Code ReportThis report lists the HTTP status codes of all requests.
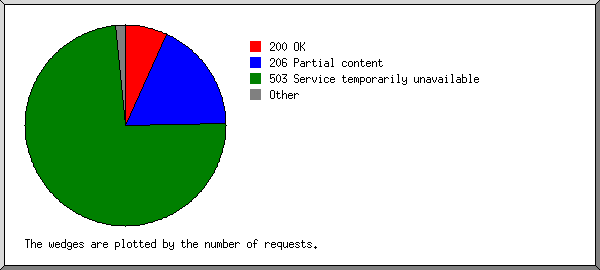
Listing status codes, sorted numerically. reqs: status code
--------: -----------
2799201: 200 OK
7363928: 206 Partial content
54583: 301 Document moved permanently
330: 302 Document found elsewhere
197433: 304 Not modified since last retrieval
647: 400 Bad request
3790: 403 Access forbidden
307238: 404 Document not found
534: 405 Method not allowed
9: 406 Document not acceptable to client
2: 414 Requested filename too long
62709: 416 Requested range not valid
12: 500 Internal server error
18: 501 Request type not supported
30217248: 503 Service temporarily unavailable
File Size ReportThis report lists the sizes of files.
       size:    reqs: %bytes:
-----------: -------: ------:
          0:   22173:       :
   1B-  10B:       0:       :
  11B- 100B:       0:       :
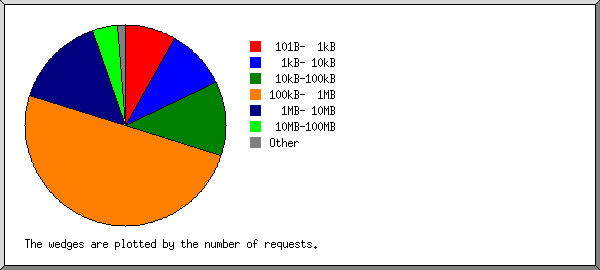
 101B-  1kB:  860982:       :
  1kB- 10kB: 1009068:  0.01%:
 10kB-100kB: 1234634:  0.15%:
100kB-  1MB: 5159031:  4.51%:
  1MB- 10MB: 1545458: 10.93%:
 10MB-100MB:  430883: 30.96%:
100MB-  1GB:   98298: 53.31%:
      > 1GB:      35:  0.12%:
File Type ReportThis report lists the extensions of files.
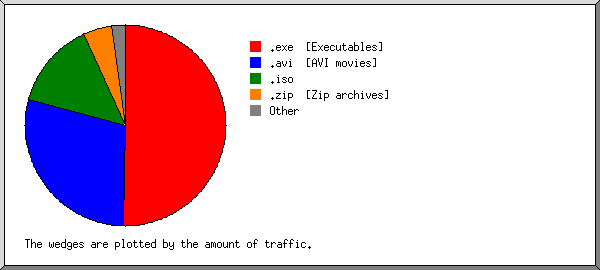
Listing extensions with at least 0.1% of the traffic, sorted by the amount of traffic. reqs: %bytes: extension -------: ------: --------- 6192771: 50.25%: .exe [Executables] 1052696: 28.82%: .avi [AVI movies] 196561: 14.15%: .iso 428080: 4.65%: .zip [Zip archives] 26251: 0.61%: .mpg [MPEG movie] 156063: 0.43%: .rpm 166999: 0.26%: .deb 10262: 0.19%: .EXE 49601: 0.16%: .gz [Gzip compressed files] 10580: 0.13%: .tar.gz [Compressed archives] 2081278: 0.48%: [not listed: 4,556 extensions] Directory ReportThis report lists the directories from which files were requested. (The figures for each directory include all of its subdirectories.)
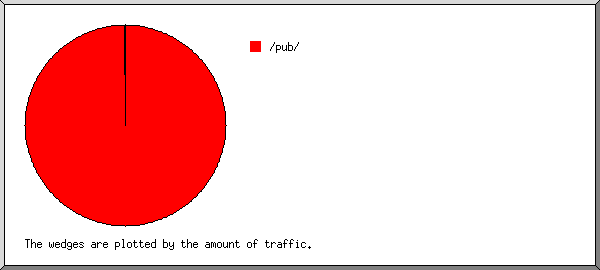
Listing directories with at least 0.01% of the traffic, sorted by the amount of traffic. reqs: %bytes: directory -------: ------: --------- 9638668: 99.95%: /pub/ 26555: 0.01%: /planetquake/ 695339: 0.04%: [not listed: 27 directories] This analysis was produced by analog 6.0. Running time: 7 minutes, 45 seconds. (Go To: Top: General Summary: Monthly Report: Daily Summary: Hourly Summary: Organisation Report: Status Code Report: File Size Report: File Type Report: Directory Report) |
 ) represents 50,000 requests for pages or part thereof.


 Mon: 1359970: 13.13%: 81637: 13.18%: 4.97: 12.89%: