Program started at Mon-03-Oct-2005 18:47. Analysed requests from Fri-01-Jul-2005 00:00 to Sun-31-Jul-2005 23:59 (31.00 days). (Go To: Top: General Summary: Monthly Report: Daily Summary: Hourly Summary: Organisation Report: Status Code Report: File Size Report: File Type Report: Directory Report) General SummaryThis report contains overall statistics. (Figures in parentheses refer to the 7-day period ending 31-Jul-2005 23:59).
Monthly ReportThis report lists the activity in each month.
Each unit ( month: reqs: %reqs: pages: %pages: Tbytes: %bytes: --------: --------: ------: -------: ------: ------: ------: Jul 2005: 22524118: 100%: 1279261: 100%: 59.15: 100%:Busiest month: Jul 2005 (1,279,261 requests for pages). Daily SummaryThis report lists the total activity for each day of the week, summed over all the weeks in the report.
Each unit ( day: reqs: %reqs: pages: %pages: Tbytes: %bytes: ---: -------: ------: ------: ------: ------: ------: Sun: 3347252: 14.86%: 184710: 14.44%: 9.50: 16.05%: Hourly SummaryThis report lists the total activity for each hour of the day, summed over all the days in the report.
Each unit ( hour: reqs: %reqs: pages: %pages: Tbytes: %bytes: ----: -------: ------: -----: ------: ------: ------: 0: 561649: 2.49%: 52120: 4.07%: 1.90: 3.20%: Organisation ReportThis report lists the organisations of the computers which requested files.
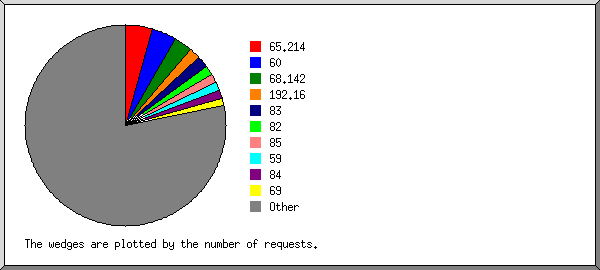
Listing the top 20 organisations by the number of requests, sorted by the number of requests. reqs: %bytes: organisation --------: ------: ------------ 1004232: 0.18%: 65.214 883815: 2.50%: 60 654057: 0.02%: 68.142 433618: 0.14%: 192.16 413714: 3.96%: 83 362150: 3.21%: 82 310455: 2.36%: 85 300646: 1.14%: 59 292477: 3.95%: 84 285122: 2.25%: 69 236125: 0.11%: 222.91 189001: 0.16%: 62.215 171628: 1.53%: 70 127352: 0.81%: 71 115255: 0.32%: 58 112157: 0.14%: 222.90 100184: 0.44%: 166.87 95884: 0.01%: 80.64 85078: 0.40%: 86 75308: 0.08%: 222.94 16275860: 76.28%: [not listed: 10,622 organisations] Status Code ReportThis report lists the HTTP status codes of all requests.
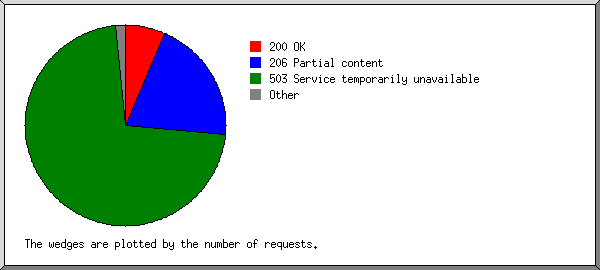
Listing status codes, sorted numerically. reqs: status code
--------: -----------
5403591: 200 OK
16716748: 206 Partial content
130818: 301 Document moved permanently
662: 302 Document found elsewhere
403779: 304 Not modified since last retrieval
1140: 400 Bad request
6497: 403 Access forbidden
661715: 404 Document not found
1024: 405 Method not allowed
1: 406 Document not acceptable to client
60958: 416 Requested range not valid
50: 500 Internal server error
33: 501 Request type not supported
60099537: 503 Service temporarily unavailable
File Size ReportThis report lists the sizes of files.
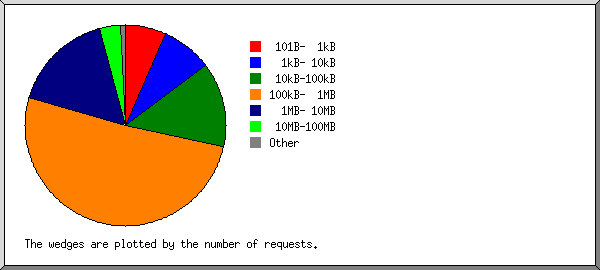
       size:     reqs: %bytes:
-----------: --------: ------:
          0:    22616:       :
   1B-  10B:        0:       :
  11B- 100B:        0:       :
 101B-  1kB:  1481688:       :
  1kB- 10kB:  1863408:  0.01%:
 10kB-100kB:  3058825:  0.26%:
100kB-  1MB: 11485580:  6.73%:
  1MB- 10MB:  3701541: 16.44%:
 10MB-100MB:   775558: 34.46%:
100MB-  1GB:   134837: 41.92%:
      > 1GB:       65:  0.17%:
File Type ReportThis report lists the extensions of files.
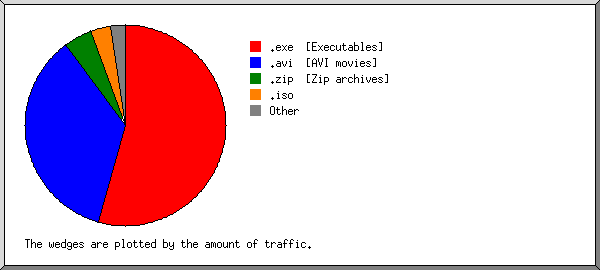
Listing extensions with at least 0.1% of the traffic, sorted by the amount of traffic. reqs: %bytes: extension --------: ------: --------- 13944128: 54.24%: .exe [Executables] 2777777: 35.69%: .avi [AVI movies] 888578: 4.55%: .zip [Zip archives] 44255: 3.22%: .iso 413502: 0.52%: .rpm 47734: 0.36%: .mpg [MPEG movie] 98042: 0.20%: .mp3 [MP3 sound files] 211246: 0.20%: .deb 25105: 0.17%: .EXE 333453: 0.14%: .tbz 3740298: 0.70%: [not listed: 5,360 extensions] Directory ReportThis report lists the directories from which files were requested. (The figures for each directory include all of its subdirectories.)
Listing directories with at least 0.01% of the traffic, sorted by the amount of traffic. reqs: %bytes: directory --------: ------: --------- 21075875: 99.92%: /pub/ 37805: 0.02%: /planetquake/ 150147: 0.02%: /~aminet/ 1260291: 0.04%: [not listed: 27 directories] This analysis was produced by analog 6.0. Running time: 14 minutes, 8 seconds. (Go To: Top: General Summary: Monthly Report: Daily Summary: Hourly Summary: Organisation Report: Status Code Report: File Size Report: File Type Report: Directory Report) |
 ) represents 100,000 requests for pages or part thereof.


 Mon: 2547334: 11.31%: 131803: 10.30%: 6.93: 11.71%: