Program started at Mon-03-Oct-2005 19:01. Analysed requests from Mon-01-Aug-2005 00:00 to Wed-31-Aug-2005 23:59 (31.00 days). (Go To: Top: General Summary: Monthly Report: Daily Summary: Hourly Summary: Organisation Report: Status Code Report: File Size Report: File Type Report: Directory Report) General SummaryThis report contains overall statistics. (Figures in parentheses refer to the 7-day period ending 31-Aug-2005 23:59).
Monthly ReportThis report lists the activity in each month.
Each unit ( month: reqs: %reqs: pages: %pages: Tbytes: %bytes: --------: --------: ------: -------: ------: ------: ------: Aug 2005: 32232780: 100%: 2430554: 100%: 87.42: 100%:Busiest month: Aug 2005 (2,430,554 requests for pages). Daily SummaryThis report lists the total activity for each day of the week, summed over all the weeks in the report.
Each unit ( day: reqs: %reqs: pages: %pages: Tbytes: %bytes: ---: -------: ------: ------: ------: ------: ------: Sun: 3900008: 12.10%: 302918: 12.46%: 11.39: 13.03%: Hourly SummaryThis report lists the total activity for each hour of the day, summed over all the days in the report.
Each unit ( hour: reqs: %reqs: pages: %pages: Tbytes: %bytes: ----: -------: ------: ------: ------: ------: ------: 0: 802424: 2.49%: 91273: 3.76%: 3.03: 3.47%: Organisation ReportThis report lists the organisations of the computers which requested files.
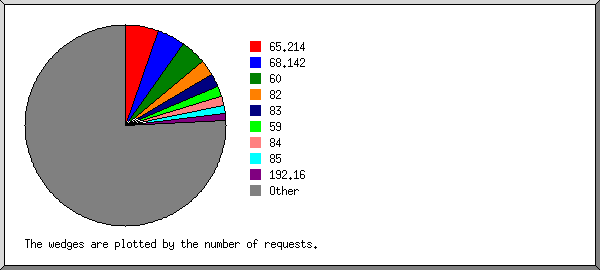
Listing the top 20 organisations by the number of requests, sorted by the number of requests. reqs: %bytes: organisation --------: ------: ------------ 1777937: 0.15%: 65.214 1401119: 0.04%: 68.142 1347538: 1.96%: 60 818341: 3.80%: 82 712710: 4.90%: 83 507042: 1.07%: 59 481667: 5.11%: 84 439778: 2.69%: 85 362123: 0.11%: 192.16 261758: 0.39%: 58 212432: 2.20%: 69 178520: 0.01%: 80.64 169336: 0.40%: 166.87 168904: 0.11%: 222.90 151639: 1.64%: 70 141133: 0.59%: 212.138 134946: 0.54%: 86 126695: 0.06%: 61.6 126262: : 207.46 116208: 0.96%: 71 22596692: 73.28%: [not listed: 11,182 organisations] Status Code ReportThis report lists the HTTP status codes of all requests.
Listing status codes, sorted numerically. reqs: status code
--------: -----------
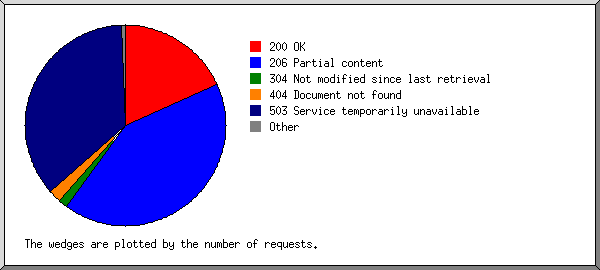
9642347: 200 OK
21868775: 206 Partial content
231130: 301 Document moved permanently
1165: 302 Document found elsewhere
721658: 304 Not modified since last retrieval
2275: 400 Bad request
11623: 403 Access forbidden
1142712: 404 Document not found
1508: 405 Method not allowed
2: 406 Document not acceptable to client
51208: 416 Requested range not valid
72: 500 Internal server error
29: 501 Request type not supported
18929223: 503 Service temporarily unavailable
File Size ReportThis report lists the sizes of files.
       size:     reqs: %bytes:
-----------: --------: ------:
          0:    21069:       :
   1B-  10B:        1:       :
  11B- 100B:        1:       :
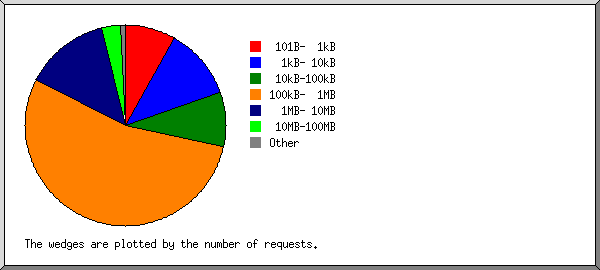
 101B-  1kB:  2627832:       :
  1kB- 10kB:  3725042:  0.02%:
 10kB-100kB:  2835643:  0.13%:
100kB-  1MB: 17398250:  6.78%:
  1MB- 10MB:  4424556: 13.36%:
 10MB-100MB:   973809: 30.54%:
100MB-  1GB:   226105: 48.37%:
      > 1GB:      472:  0.79%:
File Type ReportThis report lists the extensions of files.
Listing extensions with at least 0.1% of the traffic, sorted by the amount of traffic. reqs: %bytes: extension
--------: ------: ---------
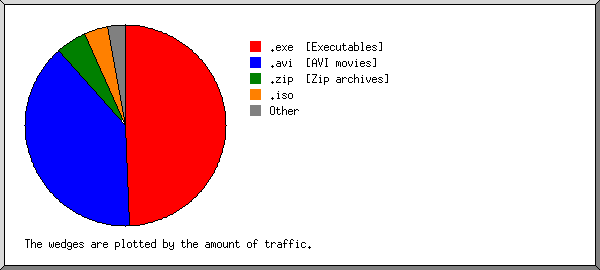
17866008: 49.30%: .exe [Executables]
4261495: 39.07%: .avi [AVI movies]
1178867: 4.94%: .zip [Zip archives]
76225: 3.85%: .iso
565361: 0.71%: .rpm
60870: 0.46%: .mpg [MPEG movie]
440004: 0.25%: .deb
26061: 0.19%: .EXE
884: 0.17%: .part1
1042: 0.16%: .part2
141548: 0.14%: .gz [Gzip compressed files]
36280: 0.11%: .tar.gz [Compressed archives]
189313: 0.13%: .mp3 [MP3 sound files]
7425102: 0.63%: [not listed: 8,065 extensions]
Directory ReportThis report lists the directories from which files were requested. (The figures for each directory include all of its subdirectories.)
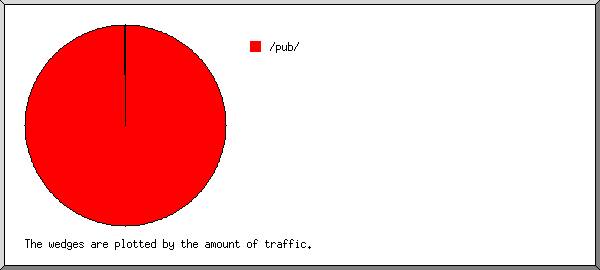
Listing directories with at least 0.01% of the traffic, sorted by the amount of traffic. reqs: %bytes: directory --------: ------: --------- 29587148: 99.91%: /pub/ 64007: 0.03%: /planetquake/ 203025: 0.02%: /~aminet/ 193903: 0.01%: /aminet/ 52944: 0.01%: /idgames2/ 2131753: 0.03%: [not listed: 29 directories] This analysis was produced by analog 6.0. Running time: 9 minutes, 44 seconds. (Go To: Top: General Summary: Monthly Report: Daily Summary: Hourly Summary: Organisation Report: Status Code Report: File Size Report: File Type Report: Directory Report) |
 ) represents 200,000 requests for pages or part thereof.


 Wed: 5188104: 16.10%: 486973: 20.04%: 13.61: 15.57%: