Program started at Mon-03-Oct-2005 19:11. Analysed requests from Thu-01-Sep-2005 00:00 to Fri-30-Sep-2005 23:59 (30.00 days). (Go To: Top: General Summary: Monthly Report: Daily Summary: Hourly Summary: Organisation Report: Status Code Report: File Size Report: File Type Report: Directory Report) General SummaryThis report contains overall statistics. (Figures in parentheses refer to the 7-day period ending 30-Sep-2005 23:59).
Monthly ReportThis report lists the activity in each month.
Each unit ( month: reqs: %reqs: pages: %pages: Tbytes: %bytes: --------: --------: ------: -------: ------: ------: ------: Sep 2005: 28362898: 100%: 2236949: 100%: 89.41: 100%:Busiest month: Sep 2005 (2,236,949 requests for pages). Daily SummaryThis report lists the total activity for each day of the week, summed over all the weeks in the report.
Each unit ( day: reqs: %reqs: pages: %pages: Tbytes: %bytes: ---: -------: ------: ------: ------: ------: ------: Sun: 3769749: 13.29%: 286069: 12.79%: 12.61: 14.10%: Hourly SummaryThis report lists the total activity for each hour of the day, summed over all the days in the report.
Each unit ( hour: reqs: %reqs: pages: %pages: Tbytes: %bytes: ----: -------: ------: ------: ------: ------: ------: 0: 800801: 2.82%: 82304: 3.68%: 3.17: 3.55%: Organisation ReportThis report lists the organisations of the computers which requested files.
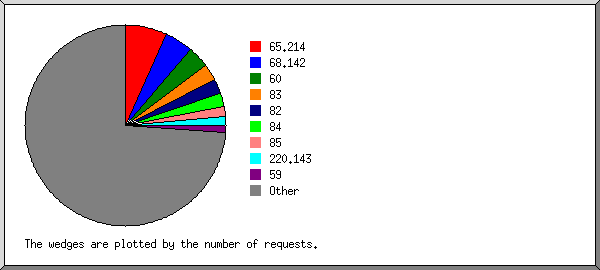
Listing the top 20 organisations by the number of requests, sorted by the number of requests. reqs: %bytes: organisation --------: ------: ------------ 1907375: 0.18%: 65.214 1335022: 0.03%: 68.142 956722: 1.74%: 60 781831: 5.00%: 83 662259: 4.05%: 82 593746: 5.28%: 84 464821: 2.89%: 85 408255: 0.14%: 220.143 307619: 1.00%: 59 239289: 0.57%: 58 185249: 1.83%: 69 172966: : 80.64 166347: 0.10%: 202.152 164900: 0.48%: 166.87 151938: 0.05%: 61.6 145558: 1.51%: 70 143084: 0.08%: 218.164 140433: 0.05%: 201.134 139183: 0.62%: 86 134458: 0.02%: 139.179 19161843: 74.36%: [not listed: 11,307 organisations] Status Code ReportThis report lists the HTTP status codes of all requests.
Listing status codes, sorted numerically. reqs: status code
--------: -----------
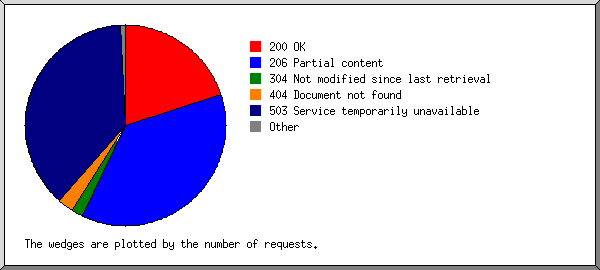
9651498: 200 OK
17800009: 206 Partial content
283137: 301 Document moved permanently
942: 302 Document found elsewhere
911391: 304 Not modified since last retrieval
3185: 400 Bad request
9373: 403 Access forbidden
1243232: 404 Document not found
1300: 405 Method not allowed
14: 406 Document not acceptable to client
3: 412 Precondition failed
1: 414 Requested filename too long
53051: 416 Requested range not valid
13: 500 Internal server error
50: 501 Request type not supported
18226089: 503 Service temporarily unavailable
File Size ReportThis report lists the sizes of files.
       size:     reqs: %bytes:
-----------: --------: ------:
          0:     8245:       :
   1B-  10B:        0:       :
  11B- 100B:        0:       :
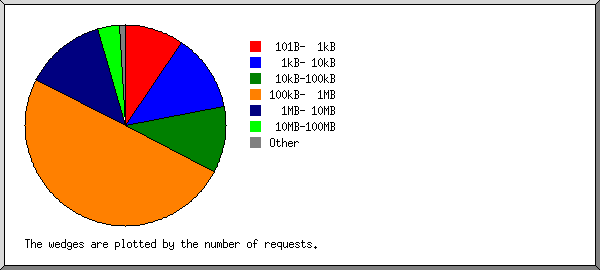
 101B-  1kB:  2700673:       :
  1kB- 10kB:  3534868:  0.01%:
 10kB-100kB:  3017131:  0.14%:
100kB-  1MB: 14133723:  5.33%:
  1MB- 10MB:  3718331: 11.78%:
 10MB-100MB:  1010986: 31.37%:
100MB-  1GB:   238548: 50.71%:
      > 1GB:      393:  0.66%:
File Type ReportThis report lists the extensions of files.
Listing extensions with at least 0.1% of the traffic, sorted by the amount of traffic. reqs: %bytes: extension
--------: ------: ---------
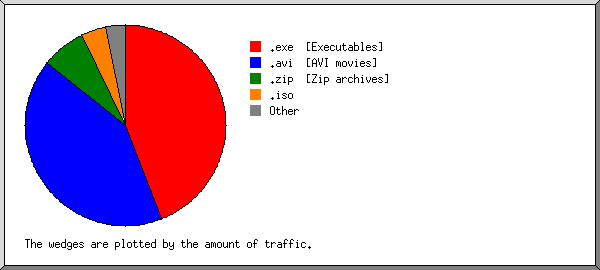
13186847: 44.12%: .exe [Executables]
4724235: 41.57%: .avi [AVI movies]
1188224: 7.17%: .zip [Zip archives]
85474: 4.02%: .iso
581797: 0.79%: .rpm
56584: 0.64%: .mpg [MPEG movie]
139408: 0.24%: .gz [Gzip compressed files]
34950: 0.21%: .tar.gz [Compressed archives]
341467: 0.21%: .deb
3484: 0.16%: .part1
14795: 0.16%: .EXE
3146: 0.15%: .part2
521818: 0.14%: .tbz
63189: 0.11%: .bz2
172712: 0.10%: .mp3 [MP3 sound files]
7279718: 0.41%: [not listed: 6,441 extensions]
Directory ReportThis report lists the directories from which files were requested. (The figures for each directory include all of its subdirectories.)
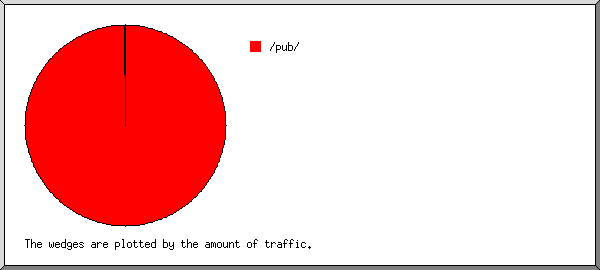
Listing directories with at least 0.01% of the traffic, sorted by the amount of traffic. reqs: %bytes: directory --------: ------: --------- 25394871: 99.92%: /pub/ 73756: 0.02%: /planetquake/ 278751: 0.01%: /~aminet/ 225590: 0.01%: /aminet/ 60214: 0.01%: /idgames2/ 2329716: 0.03%: [not listed: 28 directories] This analysis was produced by analog 6.0. Running time: 9 minutes, 35 seconds. (Go To: Top: General Summary: Monthly Report: Daily Summary: Hourly Summary: Organisation Report: Status Code Report: File Size Report: File Type Report: Directory Report) |
 ) represents 150,000 requests for pages or part thereof.


