Program started at Wed-01-Feb-2006 18:04. Analysed requests from Sun-01-Jan-2006 00:00 to Tue-31-Jan-2006 00:00 (30.00 days). (Go To: Top: General Summary: Monthly Report: Daily Summary: Hourly Summary: Organisation Report: Status Code Report: File Size Report: File Type Report: Directory Report) General SummaryThis report contains overall statistics. (Figures in parentheses refer to the 7-day period ending 31-Jan-2006 23:59).
Monthly ReportThis report lists the activity in each month.
Each unit ( month: reqs: %reqs: pages: %pages: Tbytes: %bytes: --------: -------: ------: ------: ------: ------: ------: Jan 2006: 5967460: 100%: 778022: 100%: 25.10: 100%:Busiest month: Jan 2006 (778,022 requests for pages). Daily SummaryThis report lists the total activity for each day of the week, summed over all the weeks in the report.
Each unit ( day: reqs: %reqs: pages: %pages: Tbytes: %bytes: ---: ------: ------: ------: ------: ------: ------: Sun: 985756: 16.52%: 133507: 17.16%: 4.01: 15.98%: Hourly SummaryThis report lists the total activity for each hour of the day, summed over all the days in the report.
Each unit ( hour: reqs: %reqs: pages: %pages: Tbytes: %bytes: ----: ------: ------: -----: ------: ------: ------: 0: 231883: 3.89%: 27052: 3.48%: 1.05: 4.20%: Organisation ReportThis report lists the organisations of the computers which requested files.
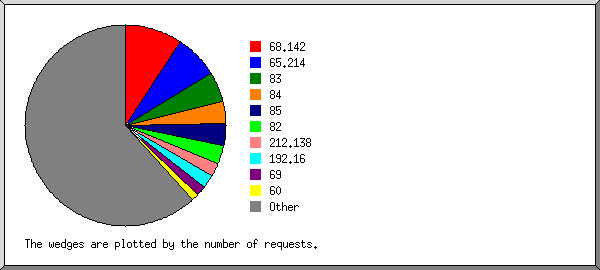
Listing the top 20 organisations by the number of requests, sorted by the number of requests. reqs: %bytes: organisation -------: ------: ------------ 566493: 0.06%: 68.142 432609: 0.16%: 65.214 284881: 5.30%: 83 222248: 3.80%: 85 218496: 7.46%: 84 186030: 4.34%: 82 137952: 1.07%: 212.138 127579: 0.02%: 192.16 102648: 2.76%: 69 65387: 0.94%: 60 45665: 0.13%: 61.247 45122: 0.10%: 222.124 39075: 2.62%: 70 38940: : 207.46 38405: 1.40%: 86 37871: 1.37%: 87 37573: 0.12%: 218.208 36010: 0.28%: 193.235 35279: 0.70%: 58 34683: 0.06%: 64.12 3234514: 67.30%: [not listed: 10,548 organisations] Status Code ReportThis report lists the HTTP status codes of all requests.
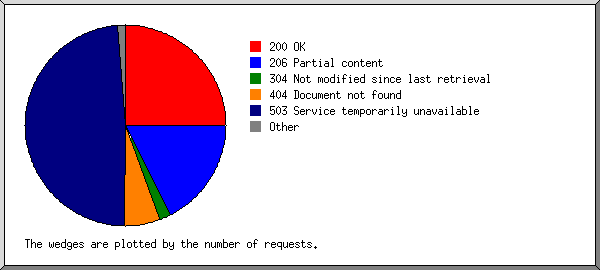
Listing status codes, sorted numerically. reqs: status code
-------: -----------
3377669: 200 OK
2340630: 206 Partial content
131805: 301 Document moved permanently
319: 302 Document found elsewhere
249161: 304 Not modified since last retrieval
3470: 400 Bad request
15694: 403 Access forbidden
785644: 404 Document not found
5409: 405 Method not allowed
5: 406 Document not acceptable to client
15162: 416 Requested range not valid
45: 500 Internal server error
44: 501 Request type not supported
7540433: 503 Service temporarily unavailable
File Size ReportThis report lists the sizes of files.
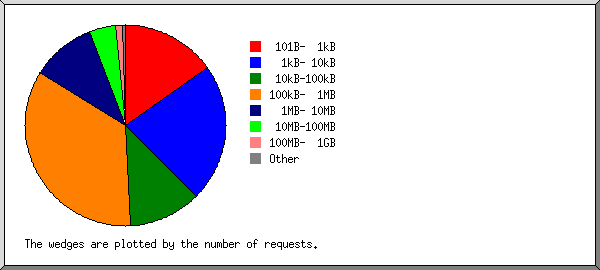
       size:    reqs: %bytes:
-----------: -------: ------:
          0:    1565:       :
   1B-  10B:       0:       :
  11B- 100B:       1:       :
 101B-  1kB:  945423:       :
  1kB- 10kB: 1268299:  0.02%:
 10kB-100kB:  697204:  0.09%:
100kB-  1MB: 2095935:  2.97%:
  1MB- 10MB:  616228:  7.15%:
 10MB-100MB:  263519: 28.71%:
100MB-  1GB:   79266: 60.95%:
      > 1GB:      20:  0.11%:
File Type ReportThis report lists the extensions of files.
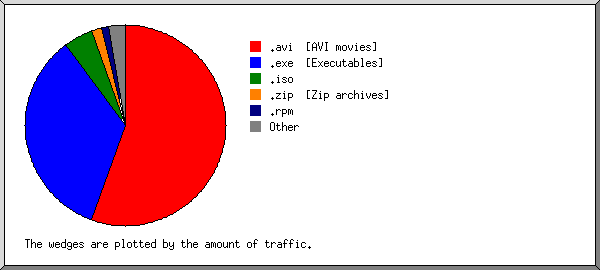
Listing extensions with at least 0.1% of the traffic, sorted by the amount of traffic. reqs: %bytes: extension -------: ------: --------- 1644466: 55.60%: .avi [AVI movies] 898360: 34.18%: .exe [Executables] 17268: 4.78%: .iso 229136: 1.63%: .zip [Zip archives] 179944: 1.16%: .rpm 51154: 0.61%: .mpg [MPEG movie] 66609: 0.43%: .mp3 [MP3 sound files] 136353: 0.28%: .deb 45931: 0.26%: .gz [Gzip compressed files] 20303: 0.21%: .tar.gz [Compressed archives] 1858: 0.16%: .dmg 10673: 0.16%: .wmv 107603: 0.11%: .tbz 2578105: 0.63%: [not listed: 5,169 extensions] Directory ReportThis report lists the directories from which files were requested. (The figures for each directory include all of its subdirectories.)
Listing directories with at least 0.01% of the traffic, sorted by the amount of traffic. reqs: %bytes: directory
-------: ------: ---------
5100945: 99.92%: /pub/
96607: 0.03%: /aminet/
609: 0.02%: http://
85284: 0.02%: /~aminet/
684015: 0.02%: [not listed: 27 directories]
This analysis was produced by analog 6.0. Running time: 2 minutes, 41 seconds. (Go To: Top: General Summary: Monthly Report: Daily Summary: Hourly Summary: Organisation Report: Status Code Report: File Size Report: File Type Report: Directory Report) |
 ) represents 60,000 requests for pages or part thereof.


 Mon: 885353: 14.84%: 109622: 14.09%: 3.46: 13.79%: