Program started at Mon-06-Mar-2006 15:12. Analysed requests from Wed-01-Feb-2006 00:00 to Tue-28-Feb-2006 23:59 (28.00 days). (Go To: Top: General Summary: Monthly Report: Daily Summary: Hourly Summary: Organisation Report: Status Code Report: File Size Report: File Type Report: Directory Report) General SummaryThis report contains overall statistics. (Figures in parentheses refer to the 7-day period ending 28-Feb-2006 23:59).
Monthly ReportThis report lists the activity in each month.
Each unit ( month: reqs: %reqs: pages: %pages: Tbytes: %bytes: --------: --------: ------: -------: ------: ------: ------: Feb 2006: 15813583: 100%: 2238945: 100%: 53.42: 100%:Busiest month: Feb 2006 (2,238,945 requests for pages). Daily SummaryThis report lists the total activity for each day of the week, summed over all the weeks in the report.
Each unit ( day: reqs: %reqs: pages: %pages: Tbytes: %bytes: ---: -------: ------: ------: ------: ------: ------: Sun: 2166564: 13.70%: 296597: 13.25%: 7.74: 14.50%: Hourly SummaryThis report lists the total activity for each hour of the day, summed over all the days in the report.
Each unit ( hour: reqs: %reqs: pages: %pages: Tbytes: %bytes: ----: ------: ------: ------: ------: ------: ------: 0: 614575: 3.89%: 84451: 3.77%: 2.27: 4.25%: Organisation ReportThis report lists the organisations of the computers which requested files.
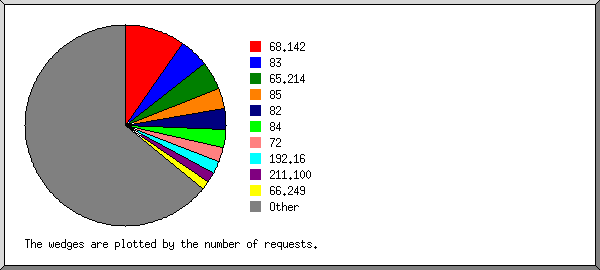
Listing the top 20 organisations by the number of requests, sorted by the number of requests. reqs: %bytes: organisation -------: ------: ------------ 1550305: 0.11%: 68.142 748804: 5.99%: 83 711566: 0.05%: 65.214 535050: 3.76%: 85 523689: 4.13%: 82 463832: 6.45%: 84 350371: 0.84%: 72 324303: 0.01%: 192.16 259281: : 211.100 212221: 0.02%: 66.249 187971: 0.01%: 207.46 157723: 0.85%: 60 151170: 0.26%: 194.69 148515: 0.07%: 80.207 144623: 2.94%: 69 131321: 1.33%: 86 123903: 1.61%: 87 115411: 0.06%: 203.175 111124: 0.97%: 212.138 110964: 0.08%: 196.203 8751436: 70.46%: [not listed: 11,362 organisations] Status Code ReportThis report lists the HTTP status codes of all requests.
Listing status codes, sorted numerically. reqs: status code
--------: -----------
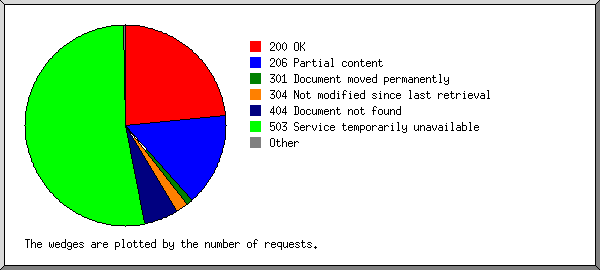
9184534: 200 OK
5850796: 206 Partial content
416898: 301 Document moved permanently
836: 302 Document found elsewhere
778253: 304 Not modified since last retrieval
4901: 400 Bad request
8765: 403 Access forbidden
2105169: 404 Document not found
10353: 405 Method not allowed
61: 406 Document not acceptable to client
44365: 416 Requested range not valid
113: 500 Internal server error
65: 501 Request type not supported
20766285: 503 Service temporarily unavailable
File Size ReportThis report lists the sizes of files.
       size:    reqs: %bytes:
-----------: -------: ------:
          0:   44282:       :
   1B-  10B:      57:       :
  11B- 100B:   32472:       :
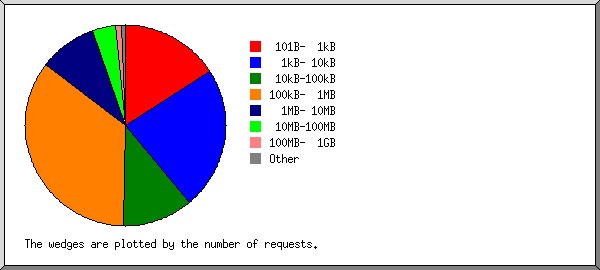
 101B-  1kB: 2521328:       :
  1kB- 10kB: 3643575:  0.03%:
 10kB-100kB: 1791497:  0.11%:
100kB-  1MB: 5546544:  3.44%:
  1MB- 10MB: 1476843:  8.03%:
 10MB-100MB:  583635: 29.49%:
100MB-  1GB:  173305: 58.81%:
      > 1GB:      45:  0.09%:
File Type ReportThis report lists the extensions of files.
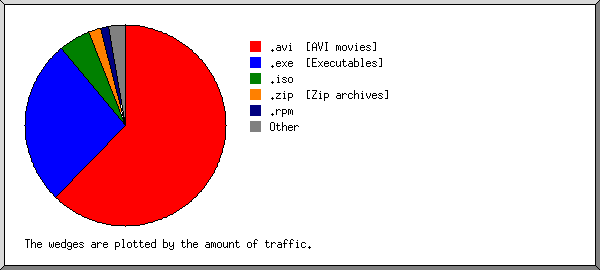
Listing extensions with at least 0.1% of the traffic, sorted by the amount of traffic. reqs: %bytes: extension -------: ------: --------- 4330966: 62.20%: .avi [AVI movies] 1979244: 26.77%: .exe [Executables] 57563: 5.07%: .iso 640026: 1.99%: .zip [Zip archives] 502668: 1.32%: .rpm 34122: 0.71%: .mpg [MPEG movie] 363187: 0.38%: .deb 115022: 0.31%: .gz [Gzip compressed files] 47179: 0.25%: .tar.gz [Compressed archives] 149335: 0.21%: .mp3 [MP3 sound files] 4929: 0.15%: .dmg 15468: 0.13%: .wmv 7621053: 0.75%: [not listed: 7,084 extensions] Directory ReportThis report lists the directories from which files were requested. (The figures for each directory include all of its subdirectories.)
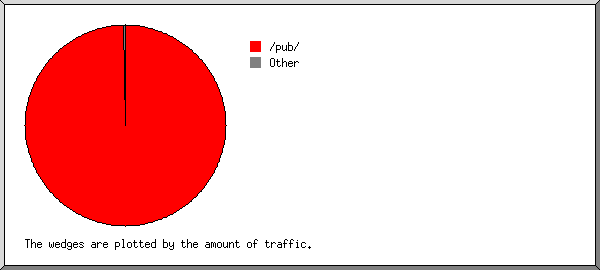
Listing directories with at least 0.01% of the traffic, sorted by the amount of traffic. reqs: %bytes: directory
--------: ------: ---------
13310757: 99.71%: /pub/
106586: 0.08%: /dist/
4431: 0.05%: /files3/
8973: 0.04%: /files/
3183: 0.03%: /files5/
3702: 0.02%: /files4/
4900: 0.02%: /files2/
2371051: 0.05%: [not listed: 121 directories]
This analysis was produced by analog 6.0. Running time: 7 minutes, 20 seconds. (Go To: Top: General Summary: Monthly Report: Daily Summary: Hourly Summary: Organisation Report: Status Code Report: File Size Report: File Type Report: Directory Report) |
 ) represents 150,000 requests for pages or part thereof.


