Program started at Tue-18-Apr-2006 18:40. Analysed requests from Wed-01-Mar-2006 00:00 to Fri-31-Mar-2006 23:59 (31.00 days). (Go To: Top: General Summary: Monthly Report: Daily Summary: Hourly Summary: Organisation Report: Status Code Report: File Size Report: File Type Report: Directory Report) General SummaryThis report contains overall statistics. (Figures in parentheses refer to the 7-day period ending 31-Mar-2006 23:59).
Monthly ReportThis report lists the activity in each month.
Each unit ( month: reqs: %reqs: pages: %pages: Tbytes: %bytes: --------: --------: ------: -------: ------: ------: ------: Mar 2006: 21118403: 100%: 3814296: 100%: 58.29: 100%:Busiest month: Mar 2006 (3,814,296 requests for pages). Daily SummaryThis report lists the total activity for each day of the week, summed over all the weeks in the report.
Each unit ( day: reqs: %reqs: pages: %pages: Tbytes: %bytes: ---: -------: ------: ------: ------: ------: ------: Sun: 2619726: 12.40%: 509946: 13.37%: 7.67: 13.16%: Hourly SummaryThis report lists the total activity for each hour of the day, summed over all the days in the report.
Each unit ( hour: reqs: %reqs: pages: %pages: Tbytes: %bytes: ----: -------: ------: ------: ------: ------: ------: 0: 792564: 3.75%: 145323: 3.81%: 2.33: 4.01%: Organisation ReportThis report lists the organisations of the computers which requested files.
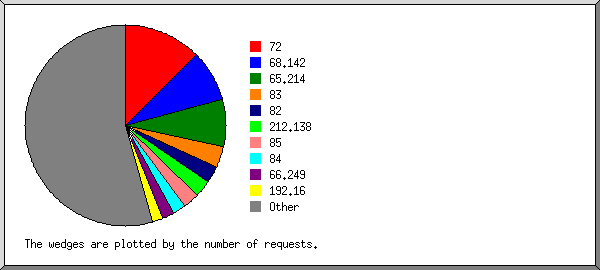
Listing the top 20 organisations by the number of requests, sorted by the number of requests. reqs: %bytes: organisation -------: ------: ------------ 2673010: 1.20%: 72 1730843: 0.04%: 68.142 1611295: 0.08%: 65.214 711919: 5.89%: 83 580824: 3.78%: 82 577169: 1.36%: 212.138 515960: 3.24%: 85 465259: 5.51%: 84 414088: 0.09%: 66.249 346506: 0.02%: 192.16 312252: 0.16%: 202.170 244594: 0.01%: 207.46 225671: 0.46%: 200.122 199325: 0.97%: 60 182684: 2.72%: 69 163392: 1.39%: 87 160756: 2.14%: 70 147500: 0.09%: 220.237 146978: 0.08%: 203.175 108731: 1.28%: 86 9599647: 69.49%: [not listed: 11,500 organisations] Status Code ReportThis report lists the HTTP status codes of all requests.
Listing status codes, sorted numerically. reqs: status code
--------: -----------
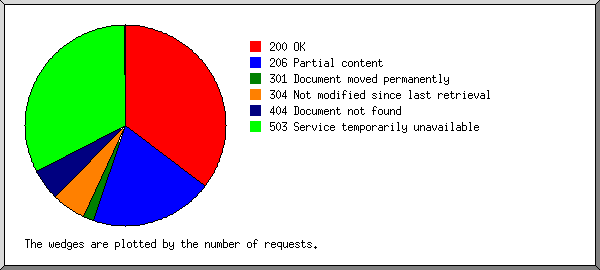
12306628: 200 OK
6885852: 206 Partial content
585792: 301 Document moved permanently
1151: 302 Document found elsewhere
1925923: 304 Not modified since last retrieval
665: 400 Bad request
10180: 403 Access forbidden
1738697: 404 Document not found
9872: 405 Method not allowed
25: 406 Document not acceptable to client
1: 414 Requested filename too long
31629: 416 Requested range not valid
117: 500 Internal server error
71: 501 Request type not supported
11370213: 503 Service temporarily unavailable
File Size ReportThis report lists the sizes of files.
       size:    reqs: %bytes:
-----------: -------: ------:
          0:   50472:       :
   1B-  10B:    1213:       :
  11B- 100B:   36122:       :
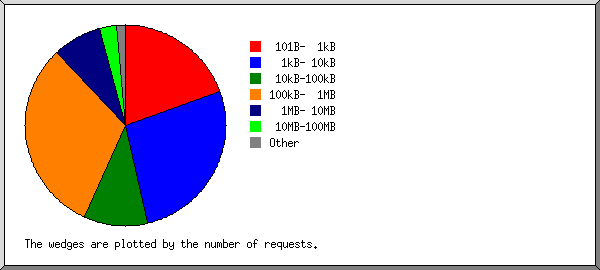
 101B-  1kB: 4124761:       :
  1kB- 10kB: 5678762:  0.04%:
 10kB-100kB: 2144263:  0.11%:
100kB-  1MB: 6621396:  3.98%:
  1MB- 10MB: 1666966:  8.26%:
 10MB-100MB:  602037: 28.28%:
100MB-  1GB:  192354: 59.22%:
      > 1GB:      57:  0.11%:
File Type ReportThis report lists the extensions of files.
Listing extensions with at least 0.1% of the traffic, sorted by the amount of traffic. reqs: %bytes: extension
--------: ------: ---------
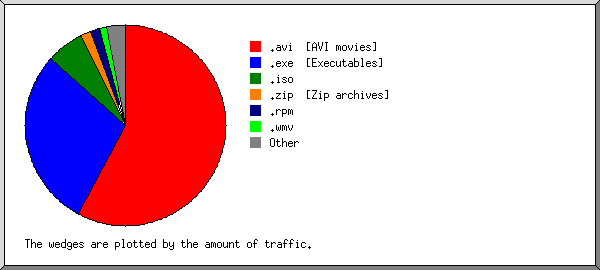
5233443: 57.77%: .avi [AVI movies]
1919601: 28.84%: .exe [Executables]
152676: 6.06%: .iso
515694: 1.71%: .zip [Zip archives]
685243: 1.49%: .rpm
266683: 1.15%: .wmv
423507: 0.75%: .mp3 [MP3 sound files]
41157: 0.73%: .mpg [MPEG movie]
128842: 0.34%: .gz [Gzip compressed files]
55436: 0.26%: .tar.gz [Compressed archives]
341554: 0.31%: .deb
4282: 0.14%: .dmg
11405721: 0.70%: [not listed: 8,003 extensions]
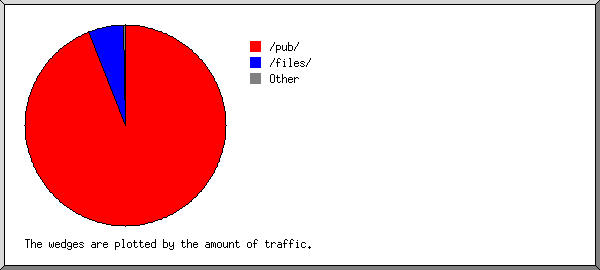
Directory ReportThis report lists the directories from which files were requested. (The figures for each directory include all of its subdirectories.)
Listing directories with at least 0.01% of the traffic, sorted by the amount of traffic. reqs: %bytes: directory
--------: ------: ---------
17073366: 94.12%: /pub/
36508: 5.63%: /files/
140722: 0.09%: /dist/
4210: 0.05%: /files3/
711626: 0.02%: /~aminet/
3264: 0.02%: /files4/
4265: 0.01%: /files2/
3144442: 0.06%: [not listed: 123 directories]
This analysis was produced by analog 6.0. Running time: 8 minutes, 24 seconds. (Go To: Top: General Summary: Monthly Report: Daily Summary: Hourly Summary: Organisation Report: Status Code Report: File Size Report: File Type Report: Directory Report) |
 ) represents 300,000 requests for pages or part thereof.


