Program started at Wed-05-Jul-2006 17:22. Analysed requests from Thu-01-Jun-2006 00:00 to Fri-30-Jun-2006 23:59 (30.00 days). (Go To: Top: General Summary: Monthly Report: Daily Summary: Hourly Summary: Organisation Report: Status Code Report: File Size Report: File Type Report: Directory Report) General SummaryThis report contains overall statistics. (Figures in parentheses refer to the 7-day period ending 30-Jun-2006 23:59).
Monthly ReportThis report lists the activity in each month.
Each unit ( month: reqs: %reqs: pages: %pages: Tbytes: %bytes: --------: --------: ------: -------: ------: ------: ------: Jun 2006: 12849915: 100%: 2264478: 100%: 35.80: 100%:Busiest month: Jun 2006 (2,264,478 requests for pages). Daily SummaryThis report lists the total activity for each day of the week, summed over all the weeks in the report.
Each unit ( day: reqs: %reqs: pages: %pages: Tbytes: %bytes: ---: -------: ------: ------: ------: ------: ------: Sun: 1774770: 13.81%: 318082: 14.05%: 5.14: 14.35%: Hourly SummaryThis report lists the total activity for each hour of the day, summed over all the days in the report.
Each unit ( hour: reqs: %reqs: pages: %pages: Tbytes: %bytes: ----: ------: ------: ------: ------: ------: ------: 0: 497415: 3.87%: 103798: 4.58%: 1.64: 4.59%: Organisation ReportThis report lists the organisations of the computers which requested files.
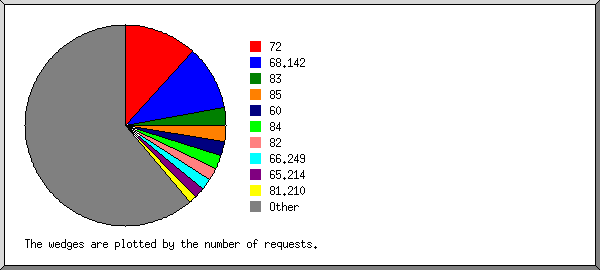
Listing the top 20 organisations by the number of requests, sorted by the number of requests. reqs: %bytes: organisation -------: ------: ------------ 1510925: 1.24%: 72 1346924: 0.08%: 68.142 367568: 6.04%: 83 318210: 3.78%: 85 305463: 1.18%: 60 276917: 5.50%: 84 255945: 4.09%: 82 230493: 0.11%: 66.249 221096: 0.02%: 65.214 167682: 0.10%: 81.210 156044: 0.15%: 202.58 155931: 0.05%: 202.149 144359: 1.86%: 87 135376: 0.92%: 58 132652: : 207.46 126434: : 211.100 119927: 1.81%: 86 111808: 0.05%: 43 96297: 2.49%: 70 93696: 0.21%: 218.208 6576168: 70.29%: [not listed: 10,818 organisations] Status Code ReportThis report lists the HTTP status codes of all requests.
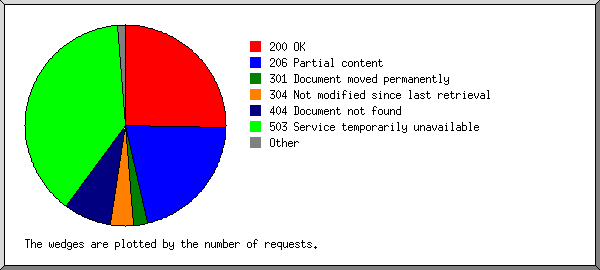
Listing status codes, sorted numerically. reqs: status code
-------: -----------
6526597: 200 OK
5374037: 206 Partial content
569577: 301 Document moved permanently
165709: 302 Document found elsewhere
949281: 304 Not modified since last retrieval
1314: 400 Bad request
48879: 403 Access forbidden
1987470: 404 Document not found
720: 405 Method not allowed
53: 406 Document not acceptable to client
9: 412 Precondition failed
102535: 416 Requested range not valid
51: 500 Internal server error
59: 501 Request type not supported
9939899: 503 Service temporarily unavailable
File Size ReportThis report lists the sizes of files.
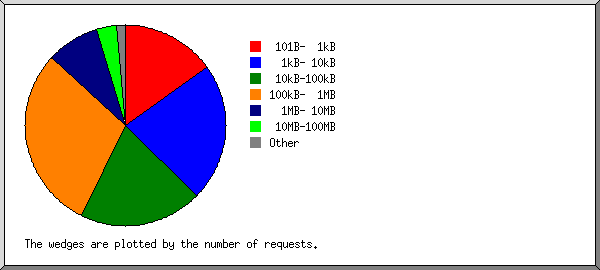
       size:    reqs: %bytes:
-----------: -------: ------:
          0:   41131:       :
   1B-  10B:      81:       :
  11B- 100B:   17850:       :
 101B-  1kB: 1953463:       :
  1kB- 10kB: 2850284:  0.03%:
 10kB-100kB: 2531004:  0.32%:
100kB-  1MB: 3817379:  3.46%:
  1MB- 10MB: 1102255:  9.16%:
 10MB-100MB:  424401: 31.83%:
100MB-  1GB:  112004: 54.83%:
      > 1GB:      63:  0.36%:
File Type ReportThis report lists the extensions of files.
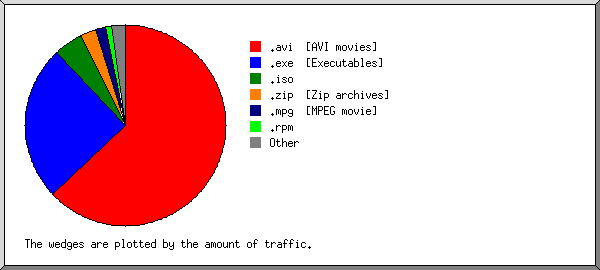
Listing extensions with at least 0.1% of the traffic, sorted by the amount of traffic. reqs: %bytes: extension -------: ------: --------- 3297784: 62.85%: .avi [AVI movies] 2210252: 25.08%: .exe [Executables] 100455: 4.82%: .iso 452751: 2.55%: .zip [Zip archives] 127543: 1.52%: .mpg [MPEG movie] 330074: 1.08%: .rpm 237256: 0.36%: .deb 66685: 0.32%: .gz [Gzip compressed files] 27575: 0.25%: .tar.gz [Compressed archives] 47595: 0.32%: .wmv 4486: 0.18%: .dmg 359844: 0.15%: .tbz 35678: 0.10%: .bz2 5579512: 0.68%: [not listed: 7,216 extensions] Directory ReportThis report lists the directories from which files were requested. (The figures for each directory include all of its subdirectories.)
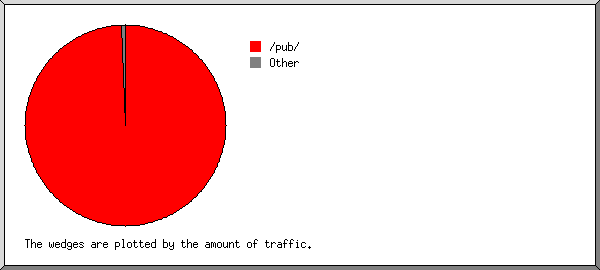
Listing directories with at least 0.01% of the traffic, sorted by the amount of traffic. reqs: %bytes: directory
--------: ------: ---------
10982587: 99.45%: /pub/
11340: 0.16%: /files/
74693: 0.14%: /dist/
5562: 0.09%: /files3/
4425: 0.03%: /files4/
4371: 0.02%: /files2/
2213: 0.02%: http://
3827: 0.01%: /filespocketpc/
52175: 0.01%: /delphi/
1271: 0.01%: /files1/
1707451: 0.06%: [not listed: 120 directories]
This analysis was produced by analog 6.0. Running time: 6 minutes, 37 seconds. (Go To: Top: General Summary: Monthly Report: Daily Summary: Hourly Summary: Organisation Report: Status Code Report: File Size Report: File Type Report: Directory Report) |
 ) represents 200,000 requests for pages or part thereof.


