Program started at Fri-25-Aug-2006 14:46. Analysed requests from Sat-01-Jul-2006 00:00 to Mon-31-Jul-2006 23:59 (31.00 days). (Go To: Top: General Summary: Monthly Report: Daily Summary: Hourly Summary: Organisation Report: Status Code Report: File Size Report: File Type Report: Directory Report) General SummaryThis report contains overall statistics. (Figures in parentheses refer to the 7-day period ending 31-Jul-2006 23:59).
Monthly ReportThis report lists the activity in each month.
Each unit ( month: reqs: %reqs: pages: %pages: Tbytes: %bytes: --------: --------: ------: -------: ------: ------: ------: Jul 2006: 10601987: 100%: 2060104: 100%: 29.10: 100%:Busiest month: Jul 2006 (2,060,104 requests for pages). Daily SummaryThis report lists the total activity for each day of the week, summed over all the weeks in the report.
Each unit ( day: reqs: %reqs: pages: %pages: Tbytes: %bytes: ---: -------: ------: ------: ------: ------: ------: Sun: 1555643: 14.67%: 311527: 15.12%: 4.46: 15.31%: Hourly SummaryThis report lists the total activity for each hour of the day, summed over all the days in the report.
Each unit ( hour: reqs: %reqs: pages: %pages: Tbytes: %bytes: ----: ------: ------: ------: ------: ------: ------: 0: 561062: 5.29%: 108403: 5.26%: 1.72: 5.91%: Organisation ReportThis report lists the organisations of the computers which requested files.
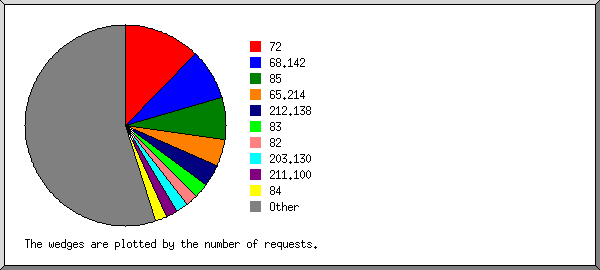
Listing the top 20 organisations by the number of requests, sorted by the number of requests. reqs: %bytes: organisation -------: ------: ------------ 1309184: 1.41%: 72 873021: 0.04%: 68.142 713583: 4.06%: 85 465903: 0.04%: 65.214 356127: 1.82%: 212.138 251632: 6.07%: 83 213760: 3.91%: 82 201209: 0.08%: 203.130 197484: : 211.100 191282: 5.93%: 84 158565: 1.94%: 87 148677: 1.04%: 60 141140: 1.30%: 58 135213: 0.01%: 207.46 119093: 0.08%: 64.12 101065: 0.02%: 66.249 87138: 2.35%: 69 82306: 2.71%: 71 81379: 2.22%: 70 74333: 0.12%: 66.198 4699893: 64.85%: [not listed: 10,366 organisations] Status Code ReportThis report lists the HTTP status codes of all requests.
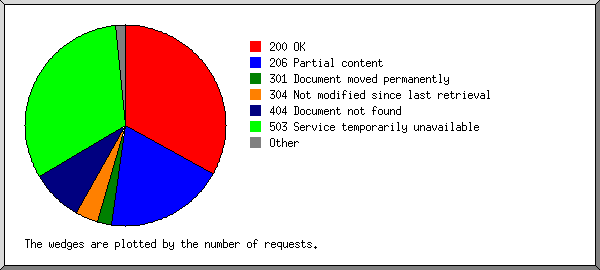
Listing status codes, sorted numerically. reqs: status code
-------: -----------
6263395: 200 OK
3640786: 206 Partial content
415303: 301 Document moved permanently
130363: 302 Document found elsewhere
697806: 304 Not modified since last retrieval
1210: 400 Bad request
12617: 403 Access forbidden
1599747: 404 Document not found
746: 405 Method not allowed
14: 406 Document not acceptable to client
1: 414 Requested filename too long
151635: 416 Requested range not valid
36: 500 Internal server error
104: 501 Request type not supported
6067491: 503 Service temporarily unavailable
File Size ReportThis report lists the sizes of files.
       size:    reqs: %bytes:
-----------: -------: ------:
          0:   23406:       :
   1B-  10B:      25:       :
  11B- 100B:   15811:       :
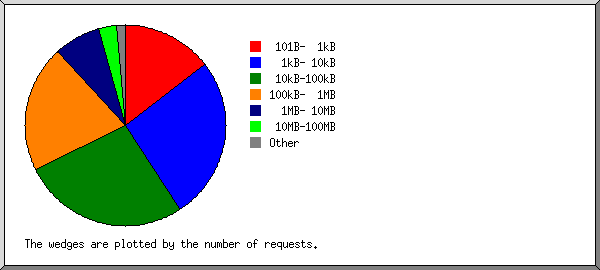
 101B-  1kB: 1553704:       :
  1kB- 10kB: 2770710:  0.04%:
 10kB-100kB: 2857970:  0.50%:
100kB-  1MB: 2162916:  2.26%:
  1MB- 10MB:  803700:  8.62%:
 10MB-100MB:  317850: 30.54%:
100MB-  1GB:   95803: 57.20%:
      > 1GB:      92:  0.84%:
File Type ReportThis report lists the extensions of files.
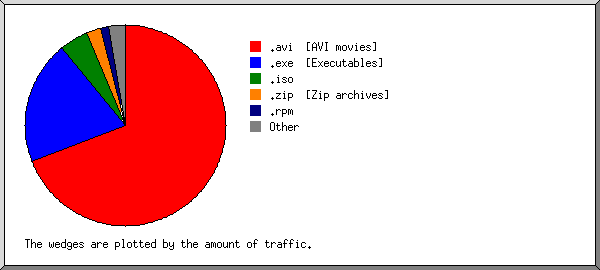
Listing extensions with at least 0.1% of the traffic, sorted by the amount of traffic. reqs: %bytes: extension -------: ------: --------- 3017888: 69.08%: .avi [AVI movies] 1380818: 19.99%: .exe [Executables] 71997: 4.58%: .iso 284403: 2.37%: .zip [Zip archives] 285946: 1.42%: .rpm 24387: 0.77%: .mpg [MPEG movie] 227552: 0.42%: .deb 65589: 0.34%: .gz [Gzip compressed files] 30753: 0.28%: .tar.gz [Compressed archives] 2266: 0.15%: .dmg 25018: 0.12%: .wmv 258845: 0.11%: .tbz 4957278: 0.67%: [not listed: 6,883 extensions] Directory ReportThis report lists the directories from which files were requested. (The figures for each directory include all of its subdirectories.)
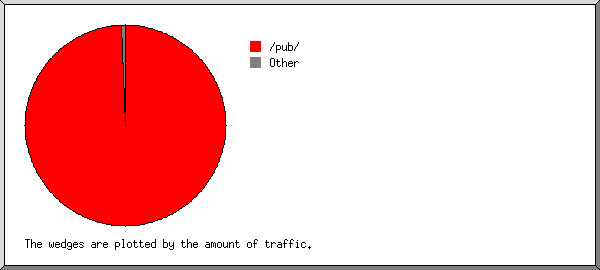
Listing directories with at least 0.01% of the traffic, sorted by the amount of traffic. reqs: %bytes: directory -------: ------: --------- 8832356: 99.42%: /pub/ 12276: 0.15%: /files/ 38473: 0.12%: /dist/ 6767: 0.09%: /files3/ 3166: 0.04%: /files1/ 5045: 0.03%: /files4/ 7377: 0.02%: http:// 4470: 0.02%: /files2/ 1556: 0.02%: /files7/ 1754: 0.01%: /files5/ 3388: 0.01%: /filespocketpc/ 345816: 0.01%: [root directory] 1339543: 0.04%: [not listed: 107 directories] This analysis was produced by analog 6.0. Running time: 5 minutes, 45 seconds. (Go To: Top: General Summary: Monthly Report: Daily Summary: Hourly Summary: Organisation Report: Status Code Report: File Size Report: File Type Report: Directory Report) |
 ) represents 150,000 requests for pages or part thereof.


