Program started at Tue-19-Sep-2006 17:56. Analysed requests from Tue-08-Aug-2006 00:00 to Thu-31-Aug-2006 23:59 (24.00 days). (Go To: Top: General Summary: Monthly Report: Daily Summary: Hourly Summary: Organisation Report: Status Code Report: File Size Report: File Type Report: Directory Report) General SummaryThis report contains overall statistics. (Figures in parentheses refer to the 7-day period ending 31-Aug-2006 23:59).
Monthly ReportThis report lists the activity in each month.
Each unit ( month: reqs: %reqs: pages: %pages: Tbytes: %bytes: --------: -------: ------: -------: ------: ------: ------: Aug 2006: 8926605: 100%: 1040396: 100%: 33.02: 100%:Busiest month: Aug 2006 (1,040,396 requests for pages). Daily SummaryThis report lists the total activity for each day of the week, summed over all the weeks in the report.
Each unit ( day: reqs: %reqs: pages: %pages: Tbytes: %bytes: ---: -------: ------: ------: ------: ------: ------: Sun: 1157583: 12.97%: 121467: 11.68%: 4.39: 13.30%: Hourly SummaryThis report lists the total activity for each hour of the day, summed over all the days in the report.
Each unit ( hour: reqs: %reqs: pages: %pages: Tbytes: %bytes: ----: ------: ------: -----: ------: ------: ------: 0: 302793: 3.39%: 42091: 4.05%: 1.20: 3.62%: Organisation ReportThis report lists the organisations of the computers which requested files.
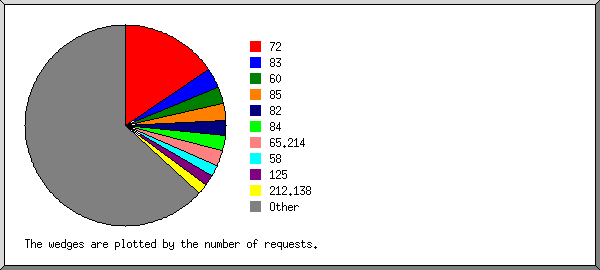
Listing the top 20 organisations by the number of requests, sorted by the number of requests. reqs: %bytes: organisation -------: ------: ------------ 1404120: 1.29%: 72 274209: 6.05%: 83 252503: 1.48%: 60 232792: 3.53%: 85 221798: 3.62%: 82 217368: 5.73%: 84 213510: 0.02%: 65.214 165186: 1.26%: 58 152099: 0.94%: 125 149773: 1.75%: 212.138 112372: 0.07%: 218.208 108463: 0.43%: 213.42 105519: 0.04%: 64.12 97553: 0.20%: 219.95 95208: 1.66%: 86 89238: 0.01%: 200.17 82980: 0.07%: 81.181 77386: : 207.46 75888: 0.04%: 61.208 71645: 2.00%: 87 4726995: 69.81%: [not listed: 10,248 organisations] Status Code ReportThis report lists the HTTP status codes of all requests.
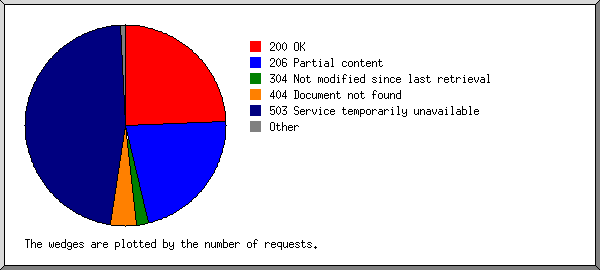
Listing status codes, sorted numerically. reqs: status code
-------: -----------
4522061: 200 OK
4049342: 206 Partial content
20318: 301 Document moved permanently
35609: 302 Document found elsewhere
355202: 304 Not modified since last retrieval
2261: 400 Bad request
3107: 403 Access forbidden
748961: 404 Document not found
12520: 405 Method not allowed
24: 406 Document not acceptable to client
68590: 416 Requested range not valid
22: 500 Internal server error
38: 501 Request type not supported
8694483: 503 Service temporarily unavailable
File Size ReportThis report lists the sizes of files.
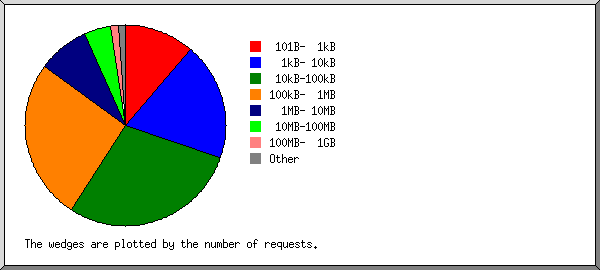
       size:    reqs: %bytes:
-----------: -------: ------:
          0:   81168:       :
   1B-  10B:      18:       :
  11B- 100B:    9403:       :
 101B-  1kB: 1019195:       :
  1kB- 10kB: 1676166:  0.02%:
 10kB-100kB: 2564114:  0.41%:
100kB-  1MB: 2330392:  2.20%:
  1MB- 10MB:  751472:  7.22%:
 10MB-100MB:  384005: 29.93%:
100MB-  1GB:  110581: 59.53%:
      > 1GB:      91:  0.69%:
File Type ReportThis report lists the extensions of files.
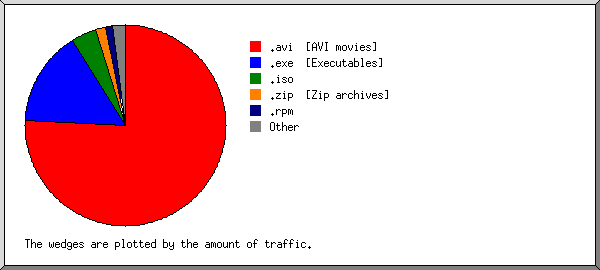
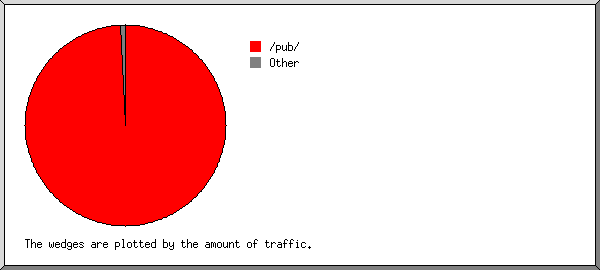
Listing extensions with at least 0.1% of the traffic, sorted by the amount of traffic. reqs: %bytes: extension -------: ------: --------- 3110872: 75.66%: .avi [AVI movies] 1131698: 15.47%: .exe [Executables] 54905: 4.04%: .iso 236377: 1.63%: .zip [Zip archives] 302536: 1.13%: .rpm 16938: 0.46%: .mpg [MPEG movie] 289581: 0.45%: .deb 3152: 0.25%: .dmg 484910: 0.23%: .tbz 68870: 0.20%: .gz [Gzip compressed files] 22712: 0.16%: .tar.gz [Compressed archives] 3226766: 0.49%: [not listed: 6,960 extensions] Directory ReportThis report lists the directories from which files were requested. (The figures for each directory include all of its subdirectories.)
Listing directories with at least 0.01% of the traffic, sorted by the amount of traffic. reqs: %bytes: directory
-------: ------: ---------
7922648: 99.36%: /pub/
9217: 0.33%: /files/
39292: 0.07%: http://
3104: 0.06%: /files3/
16396: 0.05%: /dist/
1531: 0.03%: /files5/
2252: 0.03%: /files4/
2875: 0.02%: /files2/
1256: 0.01%: /files1/
978: 0.01%: /files7/
927056: 0.03%: [not listed: 102 directories]
This analysis was produced by analog 6.0. Running time: 7 minutes, 21 seconds. (Go To: Top: General Summary: Monthly Report: Daily Summary: Hourly Summary: Organisation Report: Status Code Report: File Size Report: File Type Report: Directory Report) |
 ) represents 80,000 requests for pages or part thereof.


