Analysed requests from Fri-01-Sep-2006 00:00 to Sat-30-Sep-2006 23:59 (30.00 days). (Go To: Top: General Summary: Yearly Report: Quarterly Report: Monthly Report: Weekly Report: Daily Report: Daily Summary: Hourly Summary: Domain Report: Organisation Report: Host Report: File Size Report: File Type Report: Directory Report) General SummaryThis report contains overall statistics. (Figures in parentheses refer to the 7-day period ending 30-Sep-2006 23:59).
Yearly ReportThis report lists the activity in each year.
Each unit ( year: reqs: %reqs: pages: %pages: Tbytes: %bytes: ----: -------: ------: -----: ------: ------: ------: 2006: 1780971: 100%: 19680: 100%: 11.02: 100%:Busiest year: 2006 (19,680 requests for pages). Quarterly ReportThis report lists the activity in each quarter.
Each unit ( quarter: reqs: %reqs: pages: %pages: Tbytes: %bytes: ------------: -------: ------: -----: ------: ------: ------: Jul-Sep 2006: 1780971: 100%: 19680: 100%: 11.02: 100%:Busiest quarter: Jul-Sep 2006 (19,680 requests for pages). Monthly ReportThis report lists the activity in each month.
Each unit ( month: reqs: %reqs: pages: %pages: Tbytes: %bytes: --------: -------: ------: -----: ------: ------: ------: Sep 2006: 1780971: 100%: 19680: 100%: 11.02: 100%:Busiest month: Sep 2006 (19,680 requests for pages). Weekly ReportThis report lists the activity in each week.
Each unit ( week beg.: reqs: %reqs: pages: %pages: Tbytes: %bytes: ---------: ------: ------: -----: ------: ------: ------: 27/Aug/06: 96261: 5.40%: 1850: 9.40%: 0.69: 6.22%:Busiest week: week beginning 3/Sep/06 (9,216 requests for pages). Daily ReportThis report lists the activity in each day.
Each unit ( date: reqs: %reqs: pages: %pages: Gbytes: %bytes: ---------: ------: ------: -----: ------: ------: ------: 1/Sep/06: 53339: 2.99%: 1763: 8.96%: 330.72: 2.93%:Busiest day: 7/Sep/06 (7,804 requests for pages). Daily SummaryThis report lists the total activity for each day of the week, summed over all the weeks in the report.
Each unit ( day: reqs: %reqs: pages: %pages: Tbytes: %bytes: ---: ------: ------: -----: ------: ------: ------: Sun: 188056: 10.56%: 1308: 6.65%: 1.40: 12.66%: Hourly SummaryThis report lists the total activity for each hour of the day, summed over all the days in the report.
Each unit ( hour: reqs: %reqs: pages: %pages: Gbytes: %bytes: ----: -----: ------: -----: ------: ------: ------: 0: 76119: 4.27%: 210: 1.07%: 481.89: 4.27%: Domain ReportThis report lists the countries of the computers which requested files. Listing domains, sorted by the amount of traffic. reqs: %bytes: domain -------: ------: ------ 1780971: 100%: [unresolved numerical addresses] Organisation ReportThis report lists the organisations of the computers which requested files.
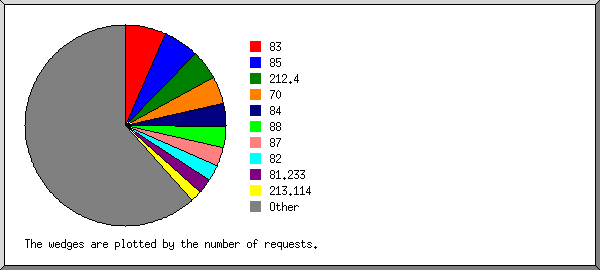
Listing the top 20 organisations by the number of requests, sorted by the number of requests. reqs: %bytes: organisation ------: ------: ------------ 117070: 9.14%: 83 103358: 6.33%: 85 84740: 8.90%: 212.4 79388: 1.92%: 70 64591: 7.51%: 84 61297: 1.94%: 88 52183: 2.62%: 87 47342: 5.13%: 82 41278: 0.86%: 81.233 34205: 1.25%: 213.114 29591: 0.48%: 148.160 28061: 1.64%: 213.112 18779: 0.25%: 193.49 17813: 0.03%: 193.40 17128: 0.42%: 81.216 16426: 1.56%: 86 16052: 0.21%: 193.14 15868: 0.13%: 192.16 15251: 0.01%: 194.85 14281: 0.14%: 193.166 906269: 49.54%: [not listed: 7,190 organisations] Host ReportThis report lists the computers which requested files.
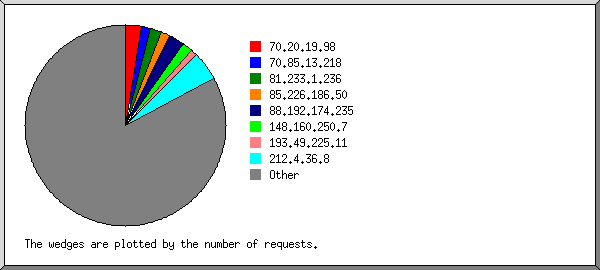
Listing the top 50 hosts by the number of requests, sorted alphabetically. reqs: %bytes: host -------: ------: ---- 7926: 0.01%: 24.143.71.147 45866: 0.96%: 70.20.19.98 26344: 0.31%: 70.85.13.218 4461: 0.10%: 80.108.38.216 6785: 0.06%: 81.27.9.231 3878: 0.03%: 81.57.43.104 5451: 0.04%: 81.216.191.13 3814: 0.02%: 81.225.24.188 3720: 0.02%: 81.227.120.86 32905: 0.34%: 81.233.1.236 3738: : 83.213.14.28 5728: 0.05%: 83.227.140.37 4443: 0.03%: 83.233.159.93 4890: 0.03%: 83.248.107.169 5339: 0.05%: 84.77.33.34 24992: 0.44%: 85.226.186.50 11412: 0.01%: 87.206.240.108 15282: 0.18%: 87.227.57.95 46317: 0.10%: 88.192.174.235 8703: 0.13%: 130.235.249.6 7154: 0.04%: 130.238.68.13 29404: 0.43%: 148.160.250.7 14726: 0.12%: 192.16.124.124 5468: : 192.102.44.227 8872: 0.04%: 192.176.230.1 6542: 0.03%: 193.10.193.113 16027: 0.21%: 193.14.163.194 16456: : 193.40.60.98 18777: 0.25%: 193.49.225.11 4396: 0.03%: 193.71.175.112 12819: : 193.166.3.8 14484: : 194.85.185.72 5610: 0.06%: 194.237.142.10 4072: 0.08%: 194.237.142.21 12487: 0.07%: 195.208.113.136 84736: 8.90%: 212.4.36.8 7617: : 212.30.210.37 6789: 0.11%: 212.181.1.150 4358: 0.02%: 212.247.229.131 3723: 0.03%: 213.28.109.13 5838: 0.03%: 213.89.85.207 4941: 0.01%: 213.100.210.203 8065: 0.04%: 213.112.173.206 9373: 0.05%: 213.112.219.118 4229: 0.03%: 213.114.11.151 13941: 0.13%: 213.114.177.158 8321: 0.04%: 213.200.169.253 4021: 0.03%: 217.74.133.70 4198: : 217.128.160.43 11220: 0.01%: 217.211.88.56 1150313: 86.27%: [not listed: 95,259 hosts] File Size ReportThis report lists the sizes of files.
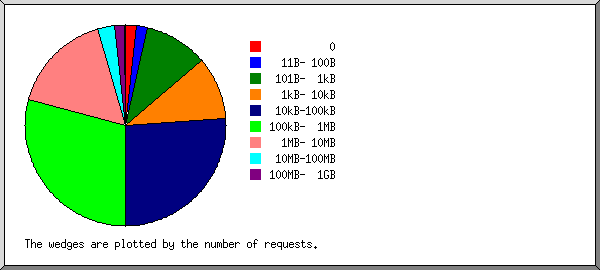
       size:   reqs: %bytes:
-----------: ------: ------:
          0:  31496:       :
   1B-  10B:    253:       :
  11B- 100B:  32104:       :
 101B-  1kB: 183993:       :
  1kB- 10kB: 180627:  0.01%:
 10kB-100kB: 462026:  0.17%:
100kB-  1MB: 517916:  1.56%:
  1MB- 10MB: 293085:  8.50%:
 10MB-100MB:  50319:  9.72%:
100MB-  1GB:  29108: 79.55%:
      > 1GB:     44:  0.49%:
File Type ReportThis report lists the extensions of files.
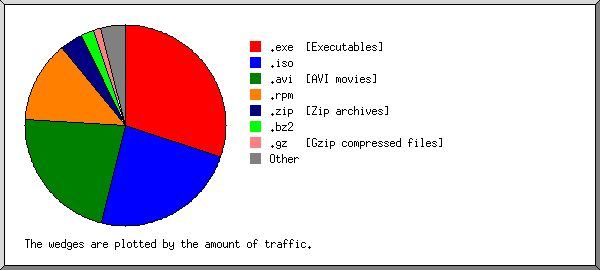
Listing extensions with at least 0.1% of the traffic, sorted by the amount of traffic. reqs: %bytes: extension ------: ------: --------- 56086: 30.07%: .exe [Executables] 6851: 23.72%: .iso 19739: 22.09%: .avi [AVI movies] 468728: 13.16%: .rpm 141794: 3.73%: .zip [Zip archives] 262213: 2.16%: .bz2 93197: 1.12%: .gz [Gzip compressed files] 47905: 0.72%: .tar.gz [Compressed archives] 132524: 0.86%: .deb 92955: 0.82%: [no extension] 31859: 0.69%: .tgz 6938: 0.55%: .cz 856: 0.10%: .dmg 467231: 0.93%: [not listed: 1,747 extensions] Directory ReportThis report lists the directories from which files were requested. (The figures for each directory include all of its subdirectories.) Listing directories with at least 0.01% of the traffic, sorted by the amount of traffic. reqs: %bytes: directory -------: ------: --------- 1780971: 100%: /ftp.sunet.se/ This analysis was produced by analog 6.0. (Go To: Top: General Summary: Yearly Report: Quarterly Report: Monthly Report: Weekly Report: Daily Report: Daily Summary: Hourly Summary: Domain Report: Organisation Report: Host Report: File Size Report: File Type Report: Directory Report) |
 ) represents 1,500 requests for pages or part thereof.


