Program started at Mon-27-Nov-2006 08:48. Analysed requests from Sun-01-Oct-2006 00:00 to Tue-31-Oct-2006 23:59 (31.00 days). (Go To: Top: General Summary: Monthly Report: Daily Summary: Hourly Summary: Organisation Report: Status Code Report: File Size Report: File Type Report: Directory Report) General SummaryThis report contains overall statistics. (Figures in parentheses refer to the 7-day period ending 31-Oct-2006 23:59).
Monthly ReportThis report lists the activity in each month.
Each unit ( month: reqs: %reqs: pages: %pages: Tbytes: %bytes: --------: --------: ------: -------: ------: ------: ------: Oct 2006: 23805933: 100%: 1866054: 100%: 109.16: 100%:Busiest month: Oct 2006 (1,866,054 requests for pages). Daily SummaryThis report lists the total activity for each day of the week, summed over all the weeks in the report.
Each unit ( day: reqs: %reqs: pages: %pages: Tbytes: %bytes: ---: -------: ------: ------: ------: ------: ------: Sun: 3825135: 16.07%: 313732: 16.81%: 18.76: 17.18%: Hourly SummaryThis report lists the total activity for each hour of the day, summed over all the days in the report.
Each unit ( hour: reqs: %reqs: pages: %pages: Tbytes: %bytes: ----: -------: ------: -----: ------: ------: ------: 0: 960354: 4.03%: 78658: 4.22%: 4.74: 4.34%: Organisation ReportThis report lists the organisations of the computers which requested files.
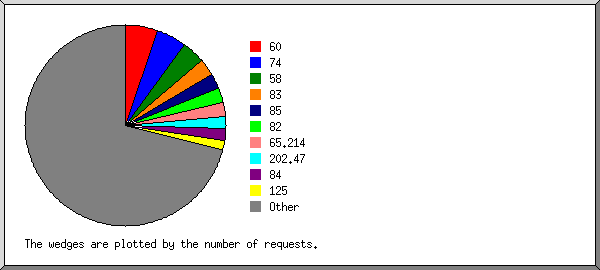
Listing the top 20 organisations by the number of requests, sorted by the number of requests. reqs: %bytes: organisation --------: ------: ------------ 1236394: 2.24%: 60 1184150: 1.01%: 74 885320: 1.69%: 58 644626: 4.89%: 83 567017: 3.63%: 85 566798: 2.87%: 82 529146: 0.01%: 65.214 474656: 0.05%: 202.47 445430: 4.89%: 84 369829: 1.50%: 125 335022: 0.90%: 72 297759: 0.03%: 210.23 289101: 1.82%: 87 281729: 0.14%: 202.157 260612: 1.67%: 88 255476: 0.02%: 66.249 229779: 1.14%: 124 229707: 1.73%: 89 220990: 0.07%: 62.68 211847: 1.82%: 202.156 14290545: 67.86%: [not listed: 11,256 organisations] Status Code ReportThis report lists the HTTP status codes of all requests.
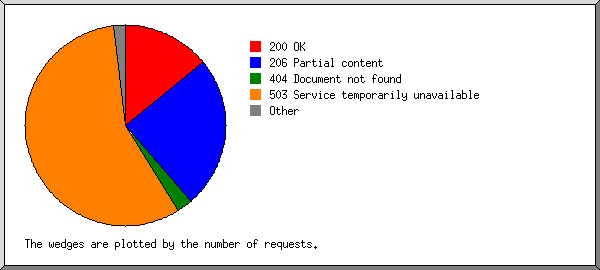
Listing status codes, sorted numerically. reqs: status code
--------: -----------
8551786: 200 OK
14746666: 206 Partial content
36188: 301 Document moved permanently
115711: 302 Document found elsewhere
507481: 304 Not modified since last retrieval
9682: 400 Bad request
288618: 403 Access forbidden
1540980: 404 Document not found
23154: 405 Method not allowed
27: 406 Document not acceptable to client
34: 414 Requested filename too long
106162: 416 Requested range not valid
47: 500 Internal server error
65: 501 Request type not supported
34431534: 503 Service temporarily unavailable
File Size ReportThis report lists the sizes of files.
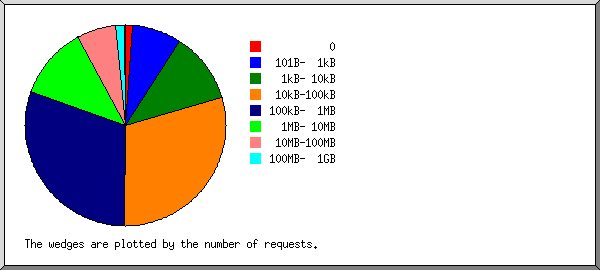
       size:    reqs: %bytes:
-----------: -------: ------:
          0:  301894:       :
   1B-  10B:     151:       :
  11B- 100B:   21537:       :
 101B-  1kB: 1876900:       :
  1kB- 10kB: 2706695:  0.01%:
 10kB-100kB: 7034693:  0.37%:
100kB-  1MB: 7219261:  2.04%:
  1MB- 10MB: 2802386:  8.33%:
 10MB-100MB: 1492392: 33.39%:
100MB-  1GB:  349664: 54.99%:
      > 1GB:     360:  0.87%:
File Type ReportThis report lists the extensions of files.
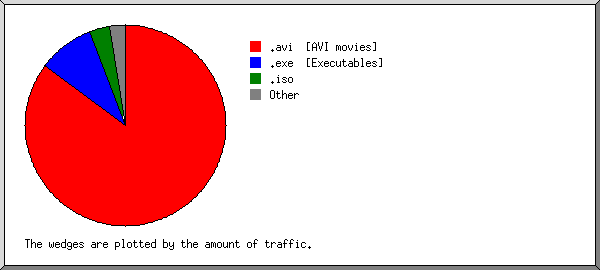
Listing extensions with at least 0.1% of the traffic, sorted by the amount of traffic. reqs: %bytes: extension --------: ------: --------- 13855056: 85.19%: .avi [AVI movies] 1992796: 9.04%: .exe [Executables] 341414: 3.26%: .iso 405885: 0.74%: .zip [Zip archives] 501702: 0.45%: .rpm 39992: 0.35%: .mpg [MPEG movie] 566663: 0.30%: .deb 184470: 0.13%: .gz [Gzip compressed files] 74101: 0.11%: .tar.gz [Compressed archives] 11124: 0.13%: .dmg 5906831: 0.40%: [not listed: 7,978 extensions] Directory ReportThis report lists the directories from which files were requested. (The figures for each directory include all of its subdirectories.)
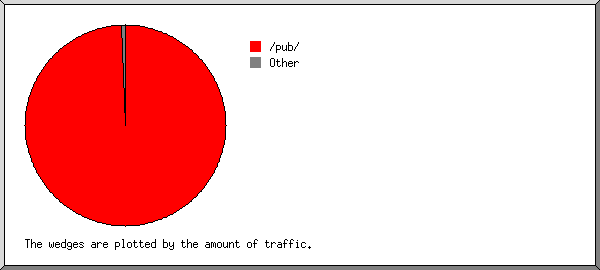
Listing directories with at least 0.01% of the traffic, sorted by the amount of traffic. reqs: %bytes: directory
--------: ------: ---------
21845385: 99.37%: /pub/
25356: 0.30%: /files/
7449: 0.05%: /files1/
9444: 0.05%: /files3/
5257: 0.05%: /files5/
10982: 0.04%: /files2/
35087: 0.04%: /dist/
48640: 0.03%: http://
3933: 0.02%: /files7/
6001: 0.02%: /files4/
59099: 0.01%: /mods/
1749300: 0.03%: [not listed: 118 directories]
This analysis was produced by analog 6.0. Running time: 36 minutes, 33 seconds. (Go To: Top: General Summary: Monthly Report: Daily Summary: Hourly Summary: Organisation Report: Status Code Report: File Size Report: File Type Report: Directory Report) |
 ) represents 150,000 requests for pages or part thereof.


 Tue: 4392046: 18.45%: 314867: 16.87%: 17.84: 16.34%: