Program started at Mon-04-Dec-2006 09:00. Analysed requests from Wed-01-Nov-2006 00:00 to Thu-30-Nov-2006 23:59 (30.00 days). (Go To: Top: General Summary: Monthly Report: Daily Summary: Hourly Summary: Organisation Report: Status Code Report: File Size Report: File Type Report: Directory Report) General SummaryThis report contains overall statistics. (Figures in parentheses refer to the 7-day period ending 30-Nov-2006 23:59).
Monthly ReportThis report lists the activity in each month.
Each unit ( month: reqs: %reqs: pages: %pages: Tbytes: %bytes: --------: --------: ------: -------: ------: ------: ------: Nov 2006: 29319375: 100%: 2321269: 100%: 138.28: 100%:Busiest month: Nov 2006 (2,321,269 requests for pages). Daily SummaryThis report lists the total activity for each day of the week, summed over all the weeks in the report.
Each unit ( day: reqs: %reqs: pages: %pages: Tbytes: %bytes: ---: -------: ------: ------: ------: ------: ------: Sun: 4102678: 13.99%: 316765: 13.65%: 19.18: 13.87%: Hourly SummaryThis report lists the total activity for each hour of the day, summed over all the days in the report.
Each unit ( hour: reqs: %reqs: pages: %pages: Tbytes: %bytes: ----: -------: ------: ------: ------: ------: ------: 0: 1065463: 3.63%: 85933: 3.70%: 5.63: 4.07%: Organisation ReportThis report lists the organisations of the computers which requested files.
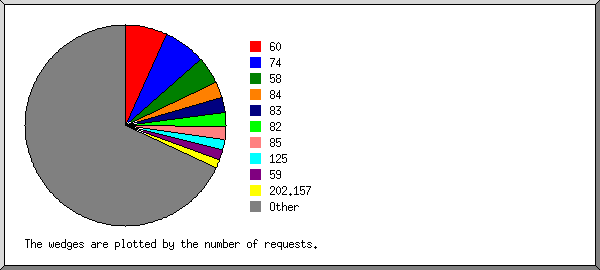
Listing the top 20 organisations by the number of requests, sorted by the number of requests. reqs: %bytes: organisation --------: ------: ------------ 2012621: 2.75%: 60 1980341: 1.05%: 74 1279430: 1.60%: 58 773739: 4.78%: 84 686518: 4.92%: 83 655277: 3.07%: 82 634653: 3.67%: 85 484201: 1.95%: 125 475866: 0.61%: 59 406673: 0.09%: 202.157 406593: 1.82%: 89 372399: 0.01%: 65.214 366039: 0.89%: 72 347566: 2.00%: 87 333528: 0.06%: 202.21 309901: 0.18%: 218.111 307560: 0.58%: 212.138 304638: 0.02%: 66.249 303545: 1.90%: 71 285315: 1.71%: 88 16592972: 66.35%: [not listed: 11,248 organisations] Status Code ReportThis report lists the HTTP status codes of all requests.
Listing status codes, sorted numerically. reqs: status code
--------: -----------
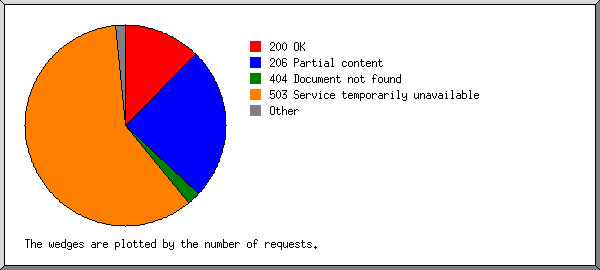
9654574: 200 OK
18965069: 206 Partial content
31082: 301 Document moved permanently
85848: 302 Document found elsewhere
699732: 304 Not modified since last retrieval
17234: 400 Bad request
225945: 403 Access forbidden
1697929: 404 Document not found
24521: 405 Method not allowed
10: 406 Document not acceptable to client
5: 412 Precondition failed
7: 414 Requested filename too long
101516: 416 Requested range not valid
25: 500 Internal server error
60: 501 Request type not supported
46039509: 503 Service temporarily unavailable
File Size ReportThis report lists the sizes of files.
       size:    reqs: %bytes:
-----------: -------: ------:
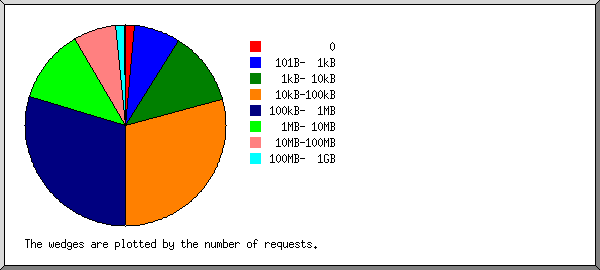
          0:  458599:       :
   1B-  10B:     159:       :
  11B- 100B:   29889:       :
 101B-  1kB: 2196705:       :
  1kB- 10kB: 3480749:  0.01%:
 10kB-100kB: 8484320:  0.36%:
100kB-  1MB: 8710365:  2.00%:
  1MB- 10MB: 3539752:  8.23%:
 10MB-100MB: 1990870: 34.87%:
100MB-  1GB:  427380: 53.40%:
      > 1GB:     587:  1.13%:
File Type ReportThis report lists the extensions of files.
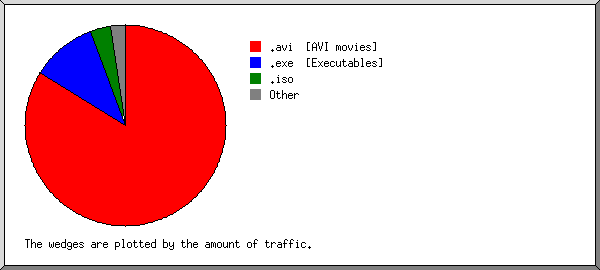
Listing extensions with at least 0.1% of the traffic, sorted by the amount of traffic. reqs: %bytes: extension --------: ------: --------- 17216079: 83.76%: .avi [AVI movies] 2630465: 10.57%: .exe [Executables] 758472: 3.30%: .iso 470466: 0.64%: .zip [Zip archives] 619837: 0.57%: .deb 50311: 0.33%: .mpg [MPEG movie] 429791: 0.29%: .rpm 375640: 0.12%: .gz [Gzip compressed files] 207774: 0.10%: .tar.gz [Compressed archives] 11961: 0.12%: .dmg 6756353: 0.29%: [not listed: 7,766 extensions] Directory ReportThis report lists the directories from which files were requested. (The figures for each directory include all of its subdirectories.)
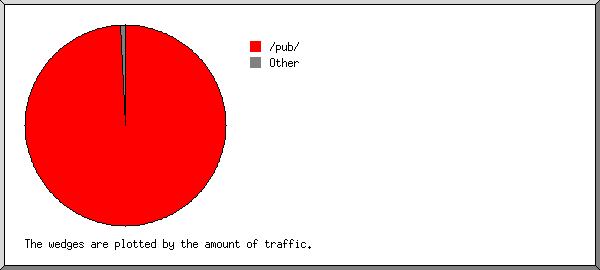
Listing directories with at least 0.01% of the traffic, sorted by the amount of traffic. reqs: %bytes: directory
--------: ------: ---------
26988940: 99.21%: /pub/
24758: 0.38%: /files/
9794: 0.13%: /files1/
8024: 0.05%: /files5/
13007: 0.05%: /files3/
5127: 0.04%: /files7/
25822: 0.03%: /dist/
139385: 0.03%: /mods/
10641: 0.03%: /files2/
5587: 0.02%: /files4/
20934: 0.01%: http://
2067356: 0.03%: [not listed: 123 directories]
This analysis was produced by analog 6.0. Running time: 36 minutes, 6 seconds. (Go To: Top: General Summary: Monthly Report: Daily Summary: Hourly Summary: Organisation Report: Status Code Report: File Size Report: File Type Report: Directory Report) |
 ) represents 200,000 requests for pages or part thereof.


