Program started at Wed-31-Jan-2007 17:58. Analysed requests from Fri-01-Dec-2006 00:00 to Sat-30-Dec-2006 00:01 (29.00 days). (Go To: Top: General Summary: Monthly Report: Daily Summary: Hourly Summary: Organisation Report: Status Code Report: File Size Report: File Type Report: Directory Report) General SummaryThis report contains overall statistics. (Figures in parentheses refer to the 7-day period ending 31-Dec-2006 23:59).
Monthly ReportThis report lists the activity in each month.
Each unit ( month: reqs: %reqs: pages: %pages: Tbytes: %bytes: --------: --------: ------: -------: ------: ------: ------: Dec 2006: 33865272: 100%: 2037119: 100%: 150.93: 100%:Busiest month: Dec 2006 (2,037,119 requests for pages). Daily SummaryThis report lists the total activity for each day of the week, summed over all the weeks in the report.
Each unit ( day: reqs: %reqs: pages: %pages: Tbytes: %bytes: ---: -------: ------: ------: ------: ------: ------: Sun: 4707940: 13.90%: 265189: 13.02%: 22.75: 15.07%: Hourly SummaryThis report lists the total activity for each hour of the day, summed over all the days in the report.
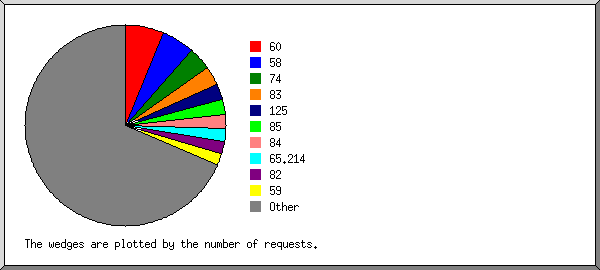
Each unit ( hour: reqs: %reqs: pages: %pages: Tbytes: %bytes: ----: -------: ------: -----: ------: ------: ------: 0: 1111709: 3.28%: 77537: 3.81%: 6.24: 4.13%: Organisation ReportThis report lists the organisations of the computers which requested files.
Listing the top 20 organisations by the number of requests, sorted by the number of requests. reqs: %bytes: organisation --------: ------: ------------ 2111778: 2.68%: 60 1838020: 2.16%: 58 1242055: 1.19%: 74 1051285: 5.25%: 83 830370: 1.63%: 125 820404: 3.82%: 85 766397: 5.21%: 84 695853: 0.01%: 65.214 687645: 2.68%: 82 615915: 0.92%: 59 468651: 2.29%: 87 449962: 0.22%: 212.116 416917: 2.06%: 89 364217: 1.12%: 124 359865: 1.78%: 88 314122: 1.76%: 202.156 301119: 0.23%: 219.95 258913: 0.06%: 202.154 256670: 0.89%: 72 254663: : 200.17 19760451: 64.02%: [not listed: 10,993 organisations] Status Code ReportThis report lists the HTTP status codes of all requests.
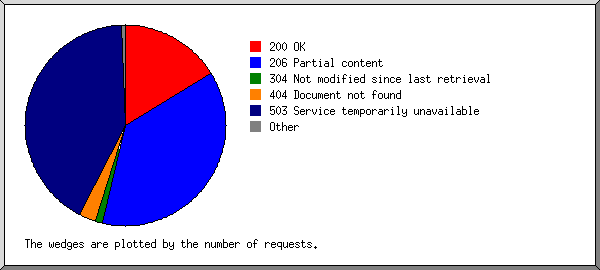
Listing status codes, sorted numerically. reqs: status code
--------: -----------
10161666: 200 OK
22938136: 206 Partial content
23327: 301 Document moved permanently
79919: 302 Document found elsewhere
765470: 304 Not modified since last retrieval
53453: 400 Bad request
29671: 403 Access forbidden
1654402: 404 Document not found
22547: 405 Method not allowed
21: 406 Document not acceptable to client
4: 414 Requested filename too long
93078: 416 Requested range not valid
20: 500 Internal server error
70: 501 Request type not supported
26000677: 503 Service temporarily unavailable
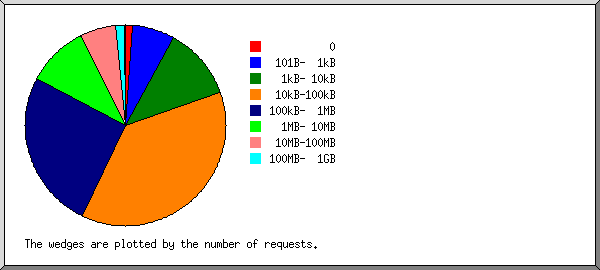
File Size ReportThis report lists the sizes of files.
       size:     reqs: %bytes:
-----------: --------: ------:
          0:   430564:       :
   1B-  10B:      167:       :
  11B- 100B:    35634:       :
 101B-  1kB:  2283717:       :
  1kB- 10kB:  3943705:  0.01%:
 10kB-100kB: 12653002:  0.50%:
100kB-  1MB:  8670214:  1.78%:
  1MB- 10MB:  3417835:  7.29%:
 10MB-100MB:  1972890: 32.75%:
100MB-  1GB:   456452: 55.62%:
      > 1GB:     1092:  2.04%:
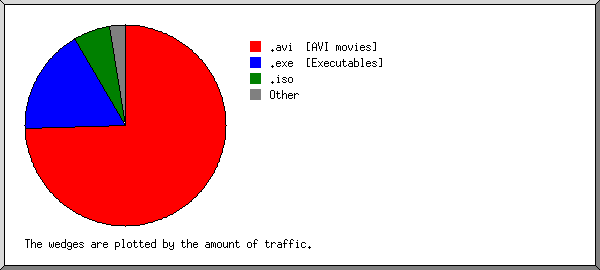
File Type ReportThis report lists the extensions of files.
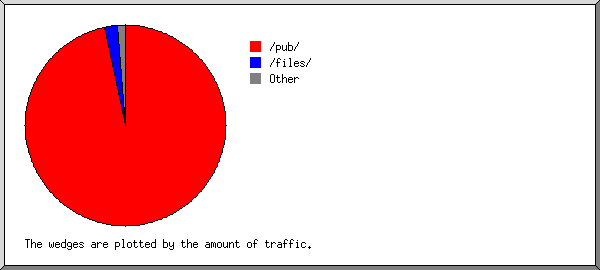
Listing extensions with at least 0.1% of the traffic, sorted by the amount of traffic. reqs: %bytes: extension --------: ------: --------- 17089764: 74.51%: .avi [AVI movies] 5021444: 17.02%: .exe [Executables] 2774135: 6.04%: .iso 705775: 0.67%: .deb 514157: 0.64%: .zip [Zip archives] 457801: 0.32%: .rpm 44230: 0.21%: .mpg [MPEG movie] 639363: 0.18%: .gz [Gzip compressed files] 401385: 0.16%: .tar.gz [Compressed archives] 6618603: 0.41%: [not listed: 6,849 extensions] Directory ReportThis report lists the directories from which files were requested. (The figures for each directory include all of its subdirectories.)
Listing directories with at least 0.01% of the traffic, sorted by the amount of traffic. reqs: %bytes: directory
--------: ------: ---------
31702010: 96.68%: /pub/
61039: 2.12%: /files/
25052: 0.49%: /files1/
21758: 0.38%: /files5/
34057: 0.15%: /files3/
42133: 0.04%: /dist/
11110: 0.04%: /files7/
8014: 0.02%: /files4/
9827: 0.02%: http://
11808: 0.02%: /files2/
1938464: 0.04%: [not listed: 123 directories]
This analysis was produced by analog 6.0. Running time: 14 minutes, 15 seconds. (Go To: Top: General Summary: Monthly Report: Daily Summary: Hourly Summary: Organisation Report: Status Code Report: File Size Report: File Type Report: Directory Report) |
 ) represents 150,000 requests for pages or part thereof.


