Program started at Tue-10-Apr-2007 17:30. Analysed requests from Thu-01-Feb-2007 00:00 to Wed-28-Feb-2007 23:59 (28.00 days). (Go To: Top: General Summary: Monthly Report: Daily Summary: Hourly Summary: Organisation Report: Status Code Report: File Size Report: File Type Report: Directory Report) General SummaryThis report contains overall statistics. (Figures in parentheses refer to the 7-day period ending 28-Feb-2007 23:59).
Monthly ReportThis report lists the activity in each month.
Each unit ( month: reqs: %reqs: pages: %pages: Tbytes: %bytes: --------: --------: ------: -------: ------: ------: ------: Feb 2007: 46048516: 100%: 1944898: 100%: 139.85: 100%:Busiest month: Feb 2007 (1,944,898 requests for pages). Daily SummaryThis report lists the total activity for each day of the week, summed over all the weeks in the report.
Each unit ( day: reqs: %reqs: pages: %pages: Tbytes: %bytes: ---: -------: ------: ------: ------: ------: ------: Sun: 6829136: 14.83%: 286858: 14.75%: 22.57: 16.14%: Hourly SummaryThis report lists the total activity for each hour of the day, summed over all the days in the report.
Each unit ( hour: reqs: %reqs: pages: %pages: Tbytes: %bytes: ----: -------: ------: -----: ------: ------: ------: 0: 1537842: 3.34%: 73375: 3.77%: 5.58: 3.99%: Organisation ReportThis report lists the organisations of the computers which requested files.
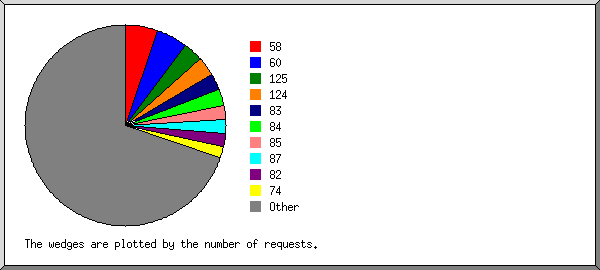
Listing the top 20 organisations by the number of requests, sorted by the number of requests. reqs: %bytes: organisation --------: ------: ------------ 2459919: 1.84%: 58 2310377: 2.41%: 60 1450136: 1.88%: 125 1426743: 1.35%: 124 1221020: 4.43%: 83 1215818: 4.79%: 84 1047358: 4.01%: 85 1013851: 2.70%: 87 923023: 2.98%: 82 876662: 1.24%: 74 835472: 0.25%: 202.58 766328: 2.03%: 88 728701: 0.84%: 59 709818: 0.26%: 219.95 598702: 2.25%: 89 560386: 0.67%: 121 439115: 0.29%: 212.116 420945: 0.71%: 91 392696: 1.46%: 86 389426: 0.03%: 202.170 26262020: 63.55%: [not listed: 11,100 organisations] Status Code ReportThis report lists the HTTP status codes of all requests.
Listing status codes, sorted numerically. reqs: status code
--------: -----------
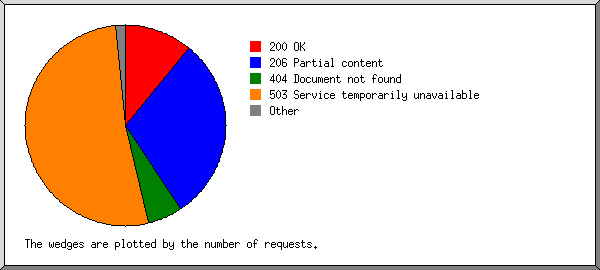
12330042: 200 OK
33099123: 206 Partial content
29582: 301 Document moved permanently
44568: 302 Document found elsewhere
619351: 304 Not modified since last retrieval
86784: 400 Bad request
29247: 403 Access forbidden
6263629: 404 Document not found
29300: 405 Method not allowed
10: 412 Precondition failed
18: 414 Requested filename too long
844445: 416 Requested range not valid
3838: 500 Internal server error
189: 501 Request type not supported
58269254: 503 Service temporarily unavailable
File Size ReportThis report lists the sizes of files.
       size:     reqs: %bytes:
-----------: --------: ------:
          0:   492662:       :
   1B-  10B:      298:       :
  11B- 100B:    35209:       :
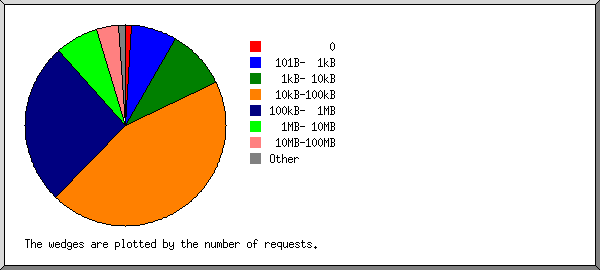
 101B-  1kB:  3374872:       :
  1kB- 10kB:  4403338:  0.01%:
 10kB-100kB: 20351553:  0.89%:
100kB-  1MB: 12062965:  2.49%:
  1MB- 10MB:  3264068:  7.33%:
 10MB-100MB:  1626523: 28.74%:
100MB-  1GB:   435410: 58.02%:
      > 1GB:     1618:  2.52%:
File Type ReportThis report lists the extensions of files.
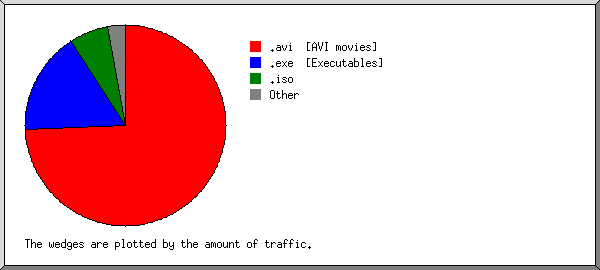
Listing extensions with at least 0.1% of the traffic, sorted by the amount of traffic. reqs: %bytes: extension --------: ------: --------- 22111900: 74.26%: .avi [AVI movies] 9190981: 16.65%: .exe [Executables] 4110000: 6.33%: .iso 623098: 0.69%: .zip [Zip archives] 755288: 0.69%: .deb 431566: 0.35%: .rpm 59048: 0.29%: .mpg [MPEG movie] 593145: 0.21%: .gz [Gzip compressed files] 423144: 0.19%: .tar.gz [Compressed archives] 19951: 0.11%: .dmg 8153533: 0.43%: [not listed: 5,180 extensions] Directory ReportThis report lists the directories from which files were requested. (The figures for each directory include all of its subdirectories.)
Listing directories with at least 0.01% of the traffic, sorted by the amount of traffic. reqs: %bytes: directory
--------: ------: ---------
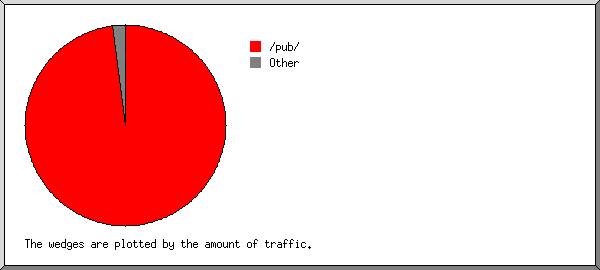
43643521: 98.05%: /pub/
30494: 0.70%: /files/
16513: 0.41%: /files1/
18972: 0.36%: /files5/
16713: 0.31%: /files7/
32793: 0.04%: /dist/
12184: 0.04%: /files3/
4797: 0.02%: /files4/
7941: 0.01%: /files2/
6330: 0.01%: /game/
4155: 0.01%: /files6/
2254097: 0.04%: [not listed: 123 directories]
This analysis was produced by analog 6.0. Running time: 30 minutes, 23 seconds. (Go To: Top: General Summary: Monthly Report: Daily Summary: Hourly Summary: Organisation Report: Status Code Report: File Size Report: File Type Report: Directory Report) |
 ) represents 150,000 requests for pages or part thereof.


