Program started at Sat-14-Apr-2007 13:30. Analysed requests from Thu-01-Mar-2007 00:00 to Fri-30-Mar-2007 00:00 (29.00 days). (Go To: Top: General Summary: Monthly Report: Daily Summary: Hourly Summary: Organisation Report: Status Code Report: File Size Report: File Type Report: Directory Report) General SummaryThis report contains overall statistics. (Figures in parentheses refer to the 7-day period ending 31-Mar-2007 23:59).
Monthly ReportThis report lists the activity in each month.
Each unit ( month: reqs: %reqs: pages: %pages: Tbytes: %bytes: --------: --------: ------: ------: ------: ------: ------: Mar 2007: 10461826: 100%: 866619: 100%: 14.26: 100%:Busiest month: Mar 2007 (866,619 requests for pages). Daily SummaryThis report lists the total activity for each day of the week, summed over all the weeks in the report.
Each unit ( day: reqs: %reqs: pages: %pages: Tbytes: %bytes: ---: -------: ------: ------: ------: ------: ------: Sun: 1303748: 12.46%: 109396: 12.62%: 1.96: 13.73%: Hourly SummaryThis report lists the total activity for each hour of the day, summed over all the days in the report.
Each unit ( hour: reqs: %reqs: pages: %pages: Gbytes: %bytes: ----: ------: ------: -----: ------: ------: ------: 0: 322251: 3.08%: 30071: 3.47%: 506.10: 3.47%: Organisation ReportThis report lists the organisations of the computers which requested files.
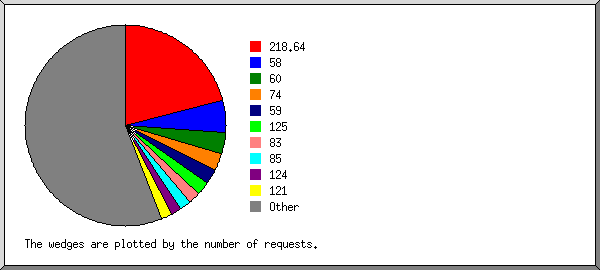
Listing the top 20 organisations by the number of requests, sorted by the number of requests. reqs: %bytes: organisation -------: ------: ------------ 2359643: 0.60%: 218.64 520033: 0.78%: 58 330587: 0.51%: 60 307867: 0.69%: 74 237673: 0.54%: 59 219166: 0.54%: 125 198018: 8.19%: 83 182865: 6.89%: 85 181405: 0.04%: 65.214 179545: 0.42%: 124 173475: 5.28%: 82 170267: 0.68%: 121 154406: 6.79%: 84 129206: : 200.17 108516: 4.12%: 87 105787: 0.02%: 65.55 103654: 2.84%: 88 97773: 2.43%: 89 68190: 0.02%: 66.249 65741: 0.02%: 196.203 4568009: 58.60%: [not listed: 9,958 organisations] Status Code ReportThis report lists the HTTP status codes of all requests.
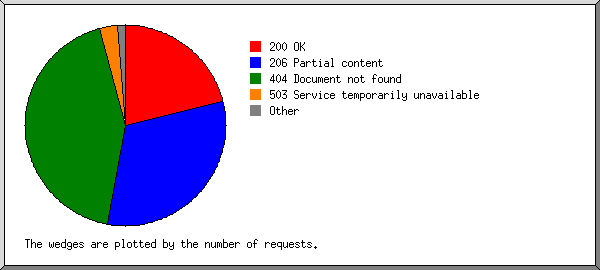
Listing status codes, sorted numerically. reqs: status code
-------: -----------
4255832: 200 OK
6051203: 206 Partial content
9252: 301 Document moved permanently
14414: 302 Document found elsewhere
154791: 304 Not modified since last retrieval
17093: 400 Bad request
1598: 403 Access forbidden
8920201: 404 Document not found
9476: 405 Method not allowed
2: 406 Document not acceptable to client
4: 412 Precondition failed
24795: 416 Requested range not valid
27: 500 Internal server error
17: 501 Request type not supported
562456: 503 Service temporarily unavailable
File Size ReportThis report lists the sizes of files.
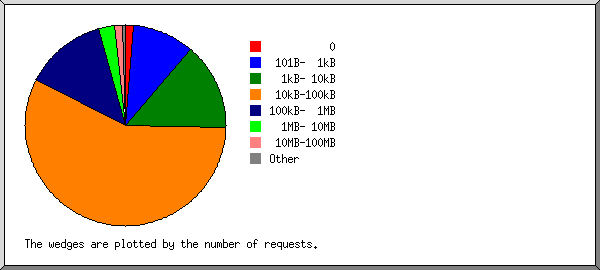
       size:    reqs: %bytes:
-----------: -------: ------:
          0:  150549:       :
   1B-  10B:      36:       :
  11B- 100B:   16806:       :
 101B-  1kB: 1066479:       :
  1kB- 10kB: 1508761:  0.04%:
 10kB-100kB: 5939203:  2.38%:
100kB-  1MB: 1350217:  2.33%:
  1MB- 10MB:  268689:  5.86%:
 10MB-100MB:  139760: 26.52%:
100MB-  1GB:   20048: 43.59%:
      > 1GB:    1278: 19.28%:
File Type ReportThis report lists the extensions of files.
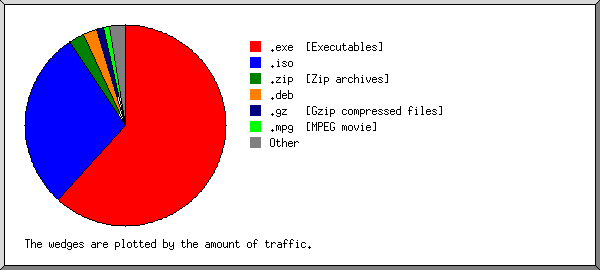
Listing extensions with at least 0.1% of the traffic, sorted by the amount of traffic. reqs: %bytes: extension -------: ------: --------- 3827935: 60.66%: .exe [Executables] 1090738: 29.59%: .iso 564872: 2.60%: .zip [Zip archives] 487142: 2.40%: .deb 1013311: 1.14%: .gz [Gzip compressed files] 709066: 0.99%: .tar.gz [Compressed archives] 35912: 1.11%: .mpg [MPEG movie] 227942: 0.66%: .rpm 20896: 0.47%: .dmg 110111: 0.18%: .mp3 [MP3 sound files] 310885: 0.18%: [no extension] 16495: 0.15%: .wmv 174260: 0.14%: .bz2 2200: 0.13%: .DU 2577423: 0.61%: [not listed: 7,343 extensions] Directory ReportThis report lists the directories from which files were requested. (The figures for each directory include all of its subdirectories.)
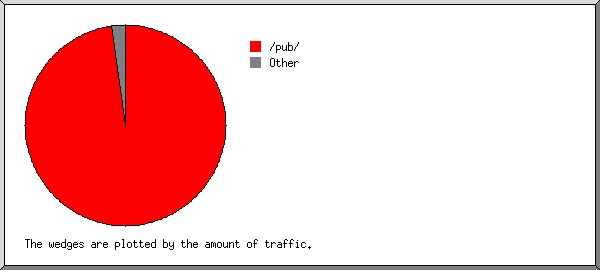
Listing directories with at least 0.01% of the traffic, sorted by the amount of traffic. reqs: %bytes: directory
-------: ------: ---------
9660205: 97.94%: /pub/
4655: 0.84%: /files1/
3833: 0.38%: /files7/
8185: 0.23%: /files/
3151: 0.21%: /files5/
8906: 0.11%: /dist/
3072: 0.07%: /files2/
1728: 0.05%: /files3/
1042: 0.04%: /game/
925: 0.02%: /files6/
1087: 0.02%: /files4/
33423: 0.01%: /delphi/
585: 0.01%: /misc/
2944: 0.01%: /mods/
726381: 0.06%: [not listed: 113 directories]
This analysis was produced by analog 6.0. Running time: 4 minutes, 14 seconds. (Go To: Top: General Summary: Monthly Report: Daily Summary: Hourly Summary: Organisation Report: Status Code Report: File Size Report: File Type Report: Directory Report) |
 ) represents 60,000 requests for pages or part thereof.


