Program started at Tue-15-May-2007 14:18. Analysed requests from Sun-01-Apr-2007 00:00 to Mon-30-Apr-2007 23:59 (30.00 days). (Go To: Top: General Summary: Monthly Report: Daily Summary: Hourly Summary: Organisation Report: Status Code Report: File Size Report: File Type Report: Directory Report) General SummaryThis report contains overall statistics. (Figures in parentheses refer to the 7-day period ending 30-Apr-2007 23:59).
Monthly ReportThis report lists the activity in each month.
Each unit ( month: reqs: %reqs: pages: %pages: Tbytes: %bytes: --------: --------: ------: -------: ------: ------: ------: Apr 2007: 27063891: 100%: 1978300: 100%: 37.56: 100%:Busiest month: Apr 2007 (1,978,300 requests for pages). Daily SummaryThis report lists the total activity for each day of the week, summed over all the weeks in the report.
Each unit ( day: reqs: %reqs: pages: %pages: Tbytes: %bytes: ---: -------: ------: ------: ------: ------: ------: Sun: 4180625: 15.45%: 338796: 17.13%: 5.79: 15.42%: Hourly SummaryThis report lists the total activity for each hour of the day, summed over all the days in the report.
Each unit ( hour: reqs: %reqs: pages: %pages: Tbytes: %bytes: ----: -------: ------: -----: ------: ------: ------: 0: 747400: 2.76%: 82905: 4.19%: 1.40: 3.72%: Organisation ReportThis report lists the organisations of the computers which requested files.
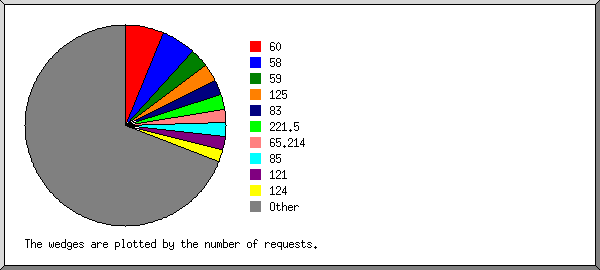
Listing the top 20 organisations by the number of requests, sorted by the number of requests. reqs: %bytes: organisation --------: ------: ------------ 1692542: 0.71%: 60 1504083: 1.10%: 58 821347: 0.52%: 59 777661: 0.63%: 125 654698: 8.94%: 83 626610: 0.11%: 221.5 593239: 0.03%: 65.214 582938: 6.25%: 85 573957: 0.35%: 121 531684: 0.43%: 124 527664: 0.56%: 74 458489: 5.32%: 82 458374: 2.80%: 88 416093: : 200.17 393497: 6.26%: 84 350012: 0.03%: 65.55 314298: 4.22%: 87 303232: 0.04%: 218.64 278864: 2.80%: 89 212261: 1.15%: 91 14992348: 57.75%: [not listed: 10,865 organisations] Status Code ReportThis report lists the HTTP status codes of all requests.
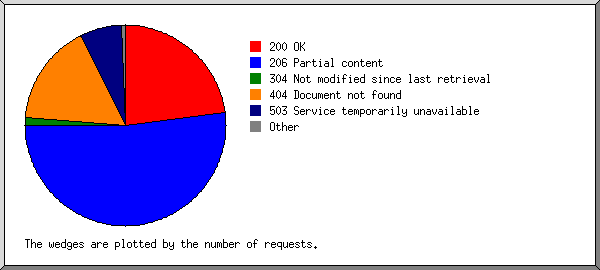
Listing status codes, sorted numerically. reqs: status code
--------: -----------
8179154: 200 OK
18465323: 206 Partial content
18390: 301 Document moved permanently
34113: 302 Document found elsewhere
419414: 304 Not modified since last retrieval
18900: 400 Bad request
22928: 403 Access forbidden
5879817: 404 Document not found
28411: 405 Method not allowed
17: 406 Document not acceptable to client
2: 412 Precondition failed
1: 413 Request too long
83633: 416 Requested range not valid
60: 500 Internal server error
163: 501 Request type not supported
2400372: 503 Service temporarily unavailable
File Size ReportThis report lists the sizes of files.
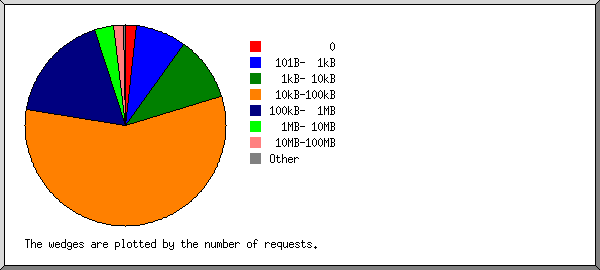
       size:     reqs: %bytes:
-----------: --------: ------:
          0:   501536:       :
   1B-  10B:       68:       :
  11B- 100B:    25770:       :
 101B-  1kB:  2204225:       :
  1kB- 10kB:  2793175:  0.03%:
 10kB-100kB: 15458542:  2.54%:
100kB-  1MB:  4754143:  3.05%:
  1MB- 10MB:   876127:  7.17%:
 10MB-100MB:   398891: 25.99%:
100MB-  1GB:    49008: 43.31%:
      > 1GB:     2406: 17.91%:
File Type ReportThis report lists the extensions of files.
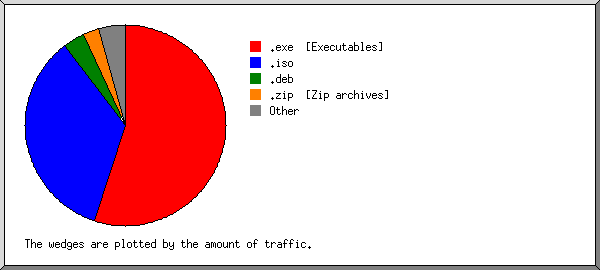
Listing extensions with at least 0.1% of the traffic, sorted by the amount of traffic. reqs: %bytes: extension --------: ------: --------- 11928932: 54.85%: .exe [Executables] 5291131: 34.74%: .iso 1069486: 3.58%: .deb 1200222: 2.56%: .zip [Zip archives] 1212124: 0.93%: .gz [Gzip compressed files] 897687: 0.83%: .tar.gz [Compressed archives] 62914: 0.92%: .mpg [MPEG movie] 212232: 0.61%: .mp3 [MP3 sound files] 292005: 0.53%: .rpm 58838: 0.26%: .dmg 64126: 0.15%: .wmv 633893: 0.13%: [no extension] 207827: 0.12%: .bz2 4830161: 0.62%: [not listed: 6,538 extensions] Directory ReportThis report lists the directories from which files were requested. (The figures for each directory include all of its subdirectories.)
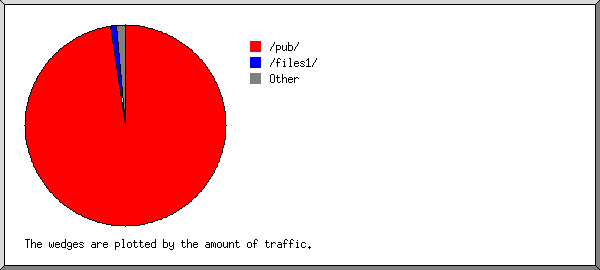
Listing directories with at least 0.01% of the traffic, sorted by the amount of traffic. reqs: %bytes: directory
--------: ------: ---------
24861429: 97.64%: /pub/
10345: 1.05%: /files1/
6302: 0.37%: /files5/
23867: 0.27%: /files/
5022: 0.16%: /files7/
24820: 0.12%: /dist/
28090: 0.08%: /mods/
5865: 0.06%: /files3/
12672: 0.06%: /files2/
6197: 0.05%: /game/
73098: 0.02%: /delphi/
1384: 0.02%: /files6/
2374: 0.02%: /files4/
2002426: 0.07%: [not listed: 122 directories]
This analysis was produced by analog 6.0. Running time: 8 minutes, 16 seconds. (Go To: Top: General Summary: Monthly Report: Daily Summary: Hourly Summary: Organisation Report: Status Code Report: File Size Report: File Type Report: Directory Report) |
 ) represents 150,000 requests for pages or part thereof.


