Program started at Mon-18-Jun-2007 09:40. Analysed requests from Tue-01-May-2007 00:00 to Thu-31-May-2007 23:59 (31.00 days). (Go To: Top: General Summary: Monthly Report: Daily Summary: Hourly Summary: Organisation Report: Status Code Report: File Size Report: File Type Report: Directory Report) General SummaryThis report contains overall statistics. (Figures in parentheses refer to the 7-day period ending 31-May-2007 23:59).
Monthly ReportThis report lists the activity in each month.
Each unit ( month: reqs: %reqs: pages: %pages: Tbytes: %bytes: --------: --------: ------: -------: ------: ------: ------: May 2007: 27400884: 100%: 1785842: 100%: 39.64: 100%:Busiest month: May 2007 (1,785,842 requests for pages). Daily SummaryThis report lists the total activity for each day of the week, summed over all the weeks in the report.
Each unit ( day: reqs: %reqs: pages: %pages: Tbytes: %bytes: ---: -------: ------: ------: ------: ------: ------: Sun: 3698130: 13.50%: 222726: 12.47%: 4.96: 12.51%: Hourly SummaryThis report lists the total activity for each hour of the day, summed over all the days in the report.
Each unit ( hour: reqs: %reqs: pages: %pages: Tbytes: %bytes: ----: -------: ------: -----: ------: ------: ------: 0: 755889: 2.76%: 70609: 3.95%: 1.49: 3.76%: Organisation ReportThis report lists the organisations of the computers which requested files.
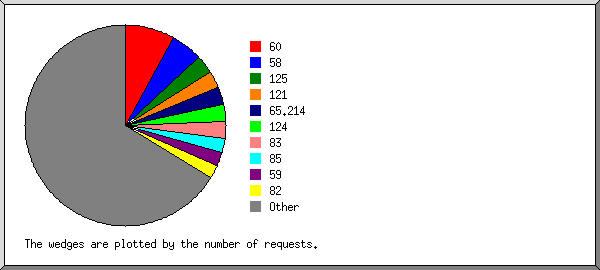
Listing the top 20 organisations by the number of requests, sorted by the number of requests. reqs: %bytes: organisation --------: ------: ------------ 2194305: 0.84%: 60 1419820: 0.82%: 58 810491: 0.66%: 125 766149: 0.37%: 121 758018: 0.05%: 65.214 755388: 0.61%: 124 725803: 7.47%: 83 654405: 6.33%: 85 598807: 0.48%: 59 579835: 5.92%: 82 551407: 0.09%: 221.5 442073: 6.39%: 84 389938: 2.72%: 89 382453: 0.61%: 74 377559: 3.05%: 88 310413: 4.23%: 87 262106: 0.13%: 123 233369: 0.02%: 65.55 207189: : 200.17 189208: 0.03%: 38 14792148: 59.18%: [not listed: 11,065 organisations] Status Code ReportThis report lists the HTTP status codes of all requests.
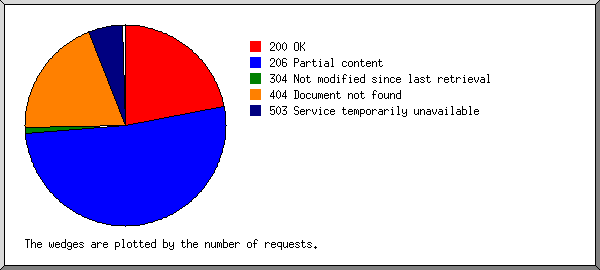
Listing status codes, sorted numerically. reqs: status code
--------: -----------
8108730: 200 OK
18921430: 206 Partial content
17565: 301 Document moved permanently
36867: 302 Document found elsewhere
370724: 304 Not modified since last retrieval
17527: 400 Bad request
10118: 403 Access forbidden
7178257: 404 Document not found
23156: 405 Method not allowed
5: 406 Document not acceptable to client
1: 412 Precondition failed
68493: 416 Requested range not valid
33: 500 Internal server error
89: 501 Request type not supported
1981018: 503 Service temporarily unavailable
File Size ReportThis report lists the sizes of files.
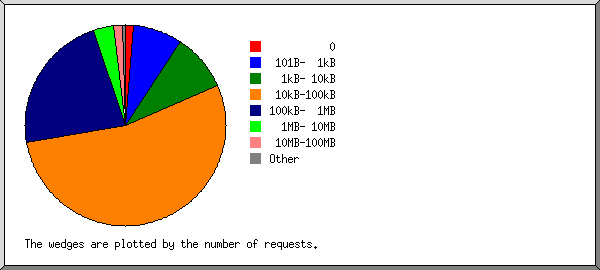
       size:     reqs: %bytes:
-----------: --------: ------:
          0:   353561:       :
   1B-  10B:      288:       :
  11B- 100B:    31647:       :
 101B-  1kB:  2190662:       :
  1kB- 10kB:  2552691:  0.03%:
 10kB-100kB: 14707374:  2.28%:
100kB-  1MB:  6203165:  3.94%:
  1MB- 10MB:   900759:  6.70%:
 10MB-100MB:   393250: 23.51%:
100MB-  1GB:    65050: 46.12%:
      > 1GB:     2437: 17.43%:
File Type ReportThis report lists the extensions of files.
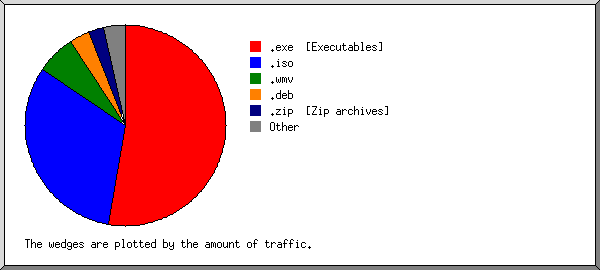
Listing extensions with at least 0.1% of the traffic, sorted by the amount of traffic. reqs: %bytes: extension --------: ------: --------- 14175196: 52.60%: .exe [Executables] 3410133: 31.85%: .iso 658706: 6.30%: .wmv 918306: 3.34%: .deb 1023549: 2.43%: .zip [Zip archives] 70870: 0.95%: .mpg [MPEG movie] 1013191: 0.53%: .gz [Gzip compressed files] 737797: 0.43%: .tar.gz [Compressed archives] 200097: 0.41%: .rpm 44191: 0.34%: .dmg 316914: 0.22%: .mp3 [MP3 sound files] 192526: 0.14%: .bz2 621646: 0.14%: [no extension] 80917: 0.14%: .lha 4674642: 0.61%: [not listed: 6,322 extensions] Directory ReportThis report lists the directories from which files were requested. (The figures for each directory include all of its subdirectories.)
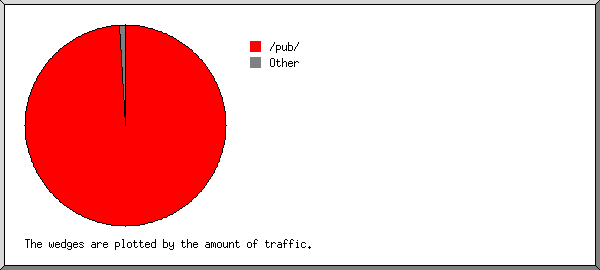
Listing directories with at least 0.01% of the traffic, sorted by the amount of traffic. reqs: %bytes: directory
--------: ------: ---------
25337497: 99.15%: /pub/
3086: 0.26%: /files1/
18063: 0.13%: /files/
47898: 0.13%: /mods/
4939: 0.06%: /game/
3957: 0.04%: /files7/
27486: 0.04%: /demo/
20266: 0.02%: /dev/
35830: 0.02%: /dist/
2471: 0.02%: /files2/
2618: 0.01%: /files6/
9258: 0.01%: /biz/
1199: 0.01%: /files5/
1886316: 0.09%: [not listed: 119 directories]
This analysis was produced by analog 6.0. Running time: 8 minutes, 37 seconds. (Go To: Top: General Summary: Monthly Report: Daily Summary: Hourly Summary: Organisation Report: Status Code Report: File Size Report: File Type Report: Directory Report) |
 ) represents 150,000 requests for pages or part thereof.


 Wed: 4142279: 15.12%: 326585: 18.29%: 6.29: 15.87%: