Program started at Tue-31-Jul-2007 20:48. Analysed requests from Fri-01-Jun-2007 00:00 to Sat-30-Jun-2007 23:59 (30.00 days). (Go To: Top: General Summary: Monthly Report: Daily Summary: Hourly Summary: Organisation Report: Status Code Report: File Size Report: File Type Report: Directory Report) General SummaryThis report contains overall statistics. (Figures in parentheses refer to the 7-day period ending 30-Jun-2007 23:59).
Monthly ReportThis report lists the activity in each month.
Each unit ( month: reqs: %reqs: pages: %pages: Tbytes: %bytes: --------: --------: ------: -------: ------: ------: ------: Jun 2007: 19805651: 100%: 1611296: 100%: 29.87: 100%:Busiest month: Jun 2007 (1,611,296 requests for pages). Daily SummaryThis report lists the total activity for each day of the week, summed over all the weeks in the report.
Each unit ( day: reqs: %reqs: pages: %pages: Tbytes: %bytes: ---: -------: ------: ------: ------: ------: ------: Sun: 2614019: 13.20%: 206735: 12.83%: 3.82: 12.80%: Hourly SummaryThis report lists the total activity for each hour of the day, summed over all the days in the report.
Each unit ( hour: reqs: %reqs: pages: %pages: Tbytes: %bytes: ----: -------: ------: -----: ------: ------: ------: 0: 565546: 2.86%: 57234: 3.55%: 1.14: 3.80%: Organisation ReportThis report lists the organisations of the computers which requested files.
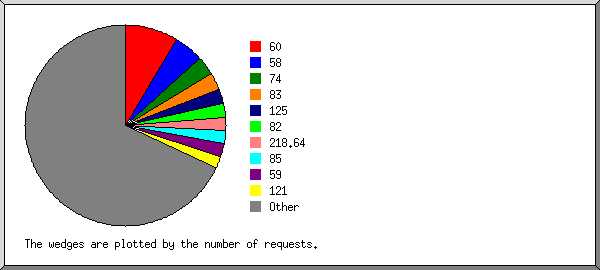
Listing the top 20 organisations by the number of requests, sorted by the number of requests. reqs: %bytes: organisation --------: ------: ------------ 1695042: 0.84%: 60 974664: 1.03%: 58 593786: 0.90%: 74 534589: 7.11%: 83 463615: 0.74%: 125 447577: 4.82%: 82 422160: 0.07%: 218.64 419527: 6.86%: 85 413321: 0.61%: 59 382827: 0.55%: 121 379391: 0.65%: 124 314735: 6.20%: 84 240861: 3.93%: 87 238348: 0.02%: 64.1 224377: 2.85%: 88 222414: 0.03%: 65.214 218074: 2.87%: 89 210093: 0.13%: 66.249 207218: 0.06%: 134.146 206125: 0.05%: 221.5 10996907: 59.70%: [not listed: 10,583 organisations] Status Code ReportThis report lists the HTTP status codes of all requests.
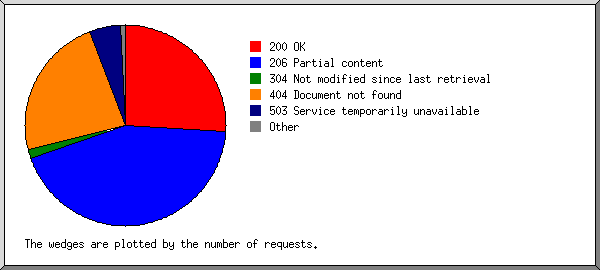
Listing status codes, sorted numerically. reqs: status code
--------: -----------
7270912: 200 OK
12135510: 206 Partial content
22322: 301 Document moved permanently
46516: 302 Document found elsewhere
399229: 304 Not modified since last retrieval
27868: 400 Bad request
11829: 403 Access forbidden
6474433: 404 Document not found
19993: 405 Method not allowed
6: 406 Document not acceptable to client
2: 412 Precondition failed
79163: 416 Requested range not valid
33: 500 Internal server error
47: 501 Request type not supported
1396410: 503 Service temporarily unavailable
File Size ReportThis report lists the sizes of files.
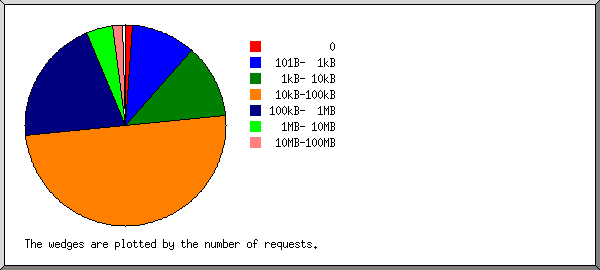
       size:    reqs: %bytes:
-----------: -------: ------:
          0:  245952:       :
   1B-  10B:     207:       :
  11B- 100B:   36891:       :
 101B-  1kB: 2054234:       :
  1kB- 10kB: 2365876:  0.03%:
 10kB-100kB: 9851326:  2.00%:
100kB-  1MB: 4041859:  3.36%:
  1MB- 10MB:  862274:  7.37%:
 10MB-100MB:  294167: 23.28%:
100MB-  1GB:   51317: 49.45%:
      > 1GB:    1548: 14.51%:
File Type ReportThis report lists the extensions of files.
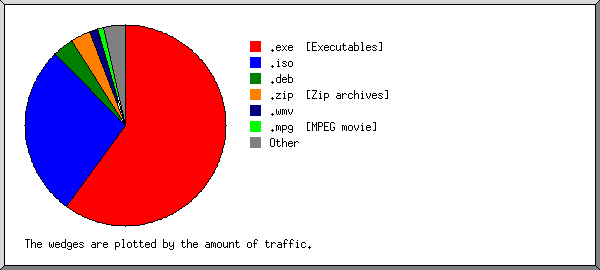
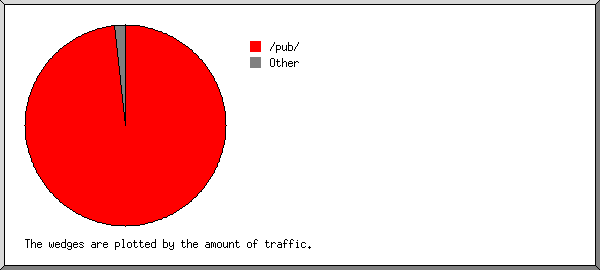
Listing extensions with at least 0.1% of the traffic, sorted by the amount of traffic. reqs: %bytes: extension -------: ------: --------- 8109848: 59.90%: .exe [Executables] 2880767: 27.68%: .iso 804465: 3.45%: .deb 986341: 3.27%: .zip [Zip archives] 229086: 1.24%: .wmv 52440: 1.04%: .mpg [MPEG movie] 1251762: 0.86%: .gz [Gzip compressed files] 1012339: 0.73%: .tar.gz [Compressed archives] 51685: 0.57%: .dmg 188941: 0.45%: .rpm 229836: 0.25%: .bz2 224352: 0.24%: .mp3 [MP3 sound files] 49078: 0.22%: .msi 518686: 0.13%: [no extension] 4228364: 0.69%: [not listed: 6,353 extensions] Directory ReportThis report lists the directories from which files were requested. (The figures for each directory include all of its subdirectories.)
Listing directories with at least 0.01% of the traffic, sorted by the amount of traffic. reqs: %bytes: directory
--------: ------: ---------
17978198: 98.40%: /pub/
4288: 0.62%: /files1/
17010: 0.48%: /files/
22530: 0.09%: /mods/
19719: 0.07%: /linux/
57127: 0.07%: /dist/
4714: 0.06%: /files7/
2229: 0.04%: /files2/
4555: 0.03%: /game/
1018: 0.02%: /files4/
1509: 0.02%: /files6/
1106: 0.02%: /files5/
9273: 0.01%: /pix/
1682375: 0.09%: [not listed: 120 directories]
This analysis was produced by analog 6.0. Running time: 10 minutes, 20 seconds. (Go To: Top: General Summary: Monthly Report: Daily Summary: Hourly Summary: Organisation Report: Status Code Report: File Size Report: File Type Report: Directory Report) |
 ) represents 150,000 requests for pages or part thereof.


