Program started at Wed-12-Sep-2007 09:07. Analysed requests from Wed-01-Aug-2007 00:00 to Fri-31-Aug-2007 23:59 (31.00 days). (Go To: Top: General Summary: Monthly Report: Daily Summary: Hourly Summary: Organisation Report: Status Code Report: File Size Report: File Type Report: Directory Report) General SummaryThis report contains overall statistics. (Figures in parentheses refer to the 7-day period ending 31-Aug-2007 23:59).
Monthly ReportThis report lists the activity in each month.
Each unit ( month: reqs: %reqs: pages: %pages: Tbytes: %bytes: --------: --------: ------: -------: ------: ------: ------: Aug 2007: 39127473: 100%: 1121717: 100%: 24.55: 100%:Busiest month: Aug 2007 (1,121,717 requests for pages). Daily SummaryThis report lists the total activity for each day of the week, summed over all the weeks in the report.
Each unit ( day: reqs: %reqs: pages: %pages: Tbytes: %bytes: ---: -------: ------: ------: ------: ------: ------: Sun: 5452331: 13.93%: 142336: 12.69%: 3.28: 13.37%: Hourly SummaryThis report lists the total activity for each hour of the day, summed over all the days in the report.
Each unit ( hour: reqs: %reqs: pages: %pages: Tbytes: %bytes: ----: -------: ------: -----: ------: ------: ------: 0: 1453586: 3.72%: 40496: 3.61%: 0.98: 3.97%: Organisation ReportThis report lists the organisations of the computers which requested files.
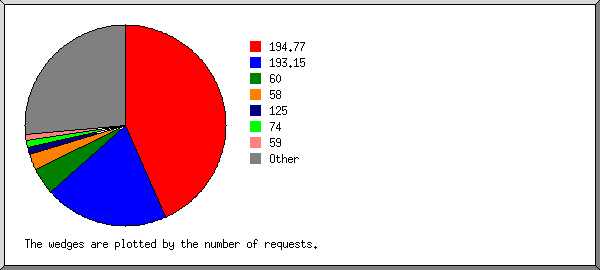
Listing the top 20 organisations by the number of requests, sorted by the number of requests. reqs: %bytes: organisation --------: ------: ------------ 16947681: 0.01%: 194.77 7820989: 0.08%: 193.15 1674983: 0.80%: 60 1023529: 0.93%: 58 480064: 0.70%: 125 409756: 0.95%: 74 391774: 0.46%: 59 344973: 7.70%: 83 343323: 0.55%: 124 321994: 0.33%: 121 319901: 4.87%: 82 303763: 6.08%: 85 227866: 0.03%: 65.55 219444: 6.01%: 84 204230: 0.07%: 200.3 164057: 3.04%: 89 157012: 2.99%: 88 150778: 3.76%: 87 136615: 0.20%: 123 136147: 0.05%: 66.249 7348594: 60.39%: [not listed: 10,309 organisations] Status Code ReportThis report lists the HTTP status codes of all requests.
Listing status codes, sorted numerically. reqs: status code
--------: -----------
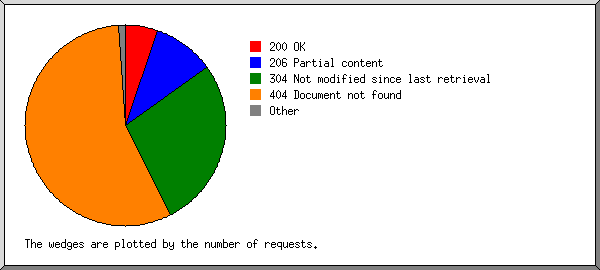
4849739: 200 OK
9168239: 206 Partial content
19711: 301 Document moved permanently
23135: 302 Document found elsewhere
25109495: 304 Not modified since last retrieval
23860: 400 Bad request
13904: 403 Access forbidden
51928584: 404 Document not found
9616: 405 Method not allowed
2: 406 Document not acceptable to client
11344: 416 Requested range not valid
11: 500 Internal server error
7: 501 Request type not supported
821269: 503 Service temporarily unavailable
File Size ReportThis report lists the sizes of files.
       size:     reqs: %bytes:
-----------: --------: ------:
          0:   118199:       :
   1B-  10B:      669:       :
  11B- 100B:    32438:       :
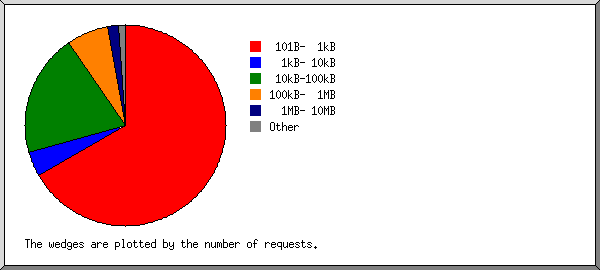
 101B-  1kB: 26060451:  0.02%:
  1kB- 10kB:  1518001:  0.02%:
 10kB-100kB:  7777336:  1.94%:
100kB-  1MB:  2682424:  2.68%:
  1MB- 10MB:   672454:  7.53%:
 10MB-100MB:   221566: 22.45%:
100MB-  1GB:    42569: 49.43%:
      > 1GB:     1366: 15.93%:
File Type ReportThis report lists the extensions of files.
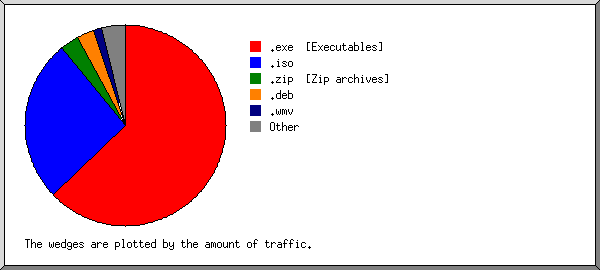
Listing extensions with at least 0.1% of the traffic, sorted by the amount of traffic. reqs: %bytes: extension --------: ------: --------- 6483628: 62.76%: .exe [Executables] 1430684: 26.38%: .iso 678591: 2.92%: .zip [Zip archives] 727776: 2.89%: .deb 253588: 1.35%: .wmv 47825: 0.95%: .mpg [MPEG movie] 13546738: 0.76%: .gz [Gzip compressed files] 991382: 0.66%: .tar.gz [Compressed archives] 35521: 0.60%: .dmg 94854: 0.30%: .rpm 133933: 0.29%: .mp3 [MP3 sound files] 203519: 0.15%: .bz2 87570: 0.12%: .lha 15403246: 0.53%: [not listed: 4,316 extensions] Directory ReportThis report lists the directories from which files were requested. (The figures for each directory include all of its subdirectories.)
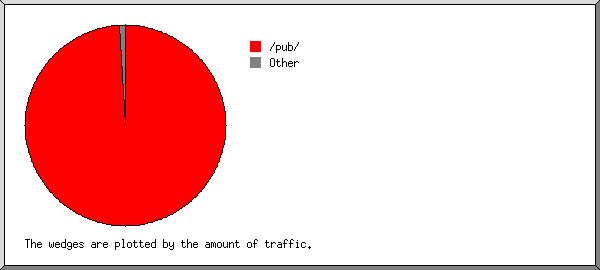
Listing directories with at least 0.01% of the traffic, sorted by the amount of traffic. reqs: %bytes: directory
--------: ------: ---------
37648533: 99.11%: /pub/
22918: 0.19%: /files/
59297: 0.14%: /mods/
1592: 0.10%: /files1/
919: 0.07%: /files5/
3981: 0.06%: /files7/
1950: 0.05%: /files4/
3244: 0.03%: /files2/
16670: 0.03%: /dist/
8829: 0.03%: /game/
2485: 0.03%: /files3/
1447: 0.02%: /files6/
17367: 0.02%: /pix/
1338241: 0.09%: [not listed: 121 directories]
This analysis was produced by analog 6.0. Running time: 34 minutes, 34 seconds. (Go To: Top: General Summary: Monthly Report: Daily Summary: Hourly Summary: Organisation Report: Status Code Report: File Size Report: File Type Report: Directory Report) |
 ) represents 80,000 requests for pages or part thereof.


