Analysed requests from Sat-01-Sep-2007 00:00 to Sun-30-Sep-2007 23:59 (30.00 days). (Go To: Top: General Summary: Yearly Report: Quarterly Report: Monthly Report: Weekly Report: Daily Report: Daily Summary: Hourly Summary: Domain Report: Organisation Report: Host Report: File Size Report: File Type Report: Directory Report) General SummaryThis report contains overall statistics. (Figures in parentheses refer to the 7-day period ending 30-Sep-2007 23:59).
Yearly ReportThis report lists the activity in each year.
Each unit ( year: reqs: %reqs: pages: %pages: Tbytes: %bytes: ----: -------: ------: -----: ------: ------: ------: 2007: 3072650: 100%: 28544: 100%: 7.83: 100%:Busiest year: 2007 (28,544 requests for pages). Quarterly ReportThis report lists the activity in each quarter.
Each unit ( quarter: reqs: %reqs: pages: %pages: Tbytes: %bytes: ------------: -------: ------: -----: ------: ------: ------: Jul-Sep 2007: 3072650: 100%: 28544: 100%: 7.83: 100%:Busiest quarter: Jul-Sep 2007 (28,544 requests for pages). Monthly ReportThis report lists the activity in each month.
Each unit ( month: reqs: %reqs: pages: %pages: Tbytes: %bytes: --------: -------: ------: -----: ------: ------: ------: Sep 2007: 3072650: 100%: 28544: 100%: 7.83: 100%:Busiest month: Sep 2007 (28,544 requests for pages). Weekly ReportThis report lists the activity in each week.
Each unit ( week beg.: reqs: %reqs: pages: %pages: Tbytes: %bytes: ---------: ------: ------: -----: ------: ------: ------: 26/Aug/07: 100423: 3.27%: 397: 1.39%: 0.30: 3.83%:Busiest week: week beginning 30/Sep/07 (12,307 requests for pages). Daily ReportThis report lists the activity in each day.
Each unit ( date: reqs: %reqs: pages: %pages: Gbytes: %bytes: ---------: ------: ------: -----: ------: ------: ------: 1/Sep/07: 100423: 3.27%: 397: 1.39%: 307.36: 3.83%:Busiest day: 30/Sep/07 (12,307 requests for pages). Daily SummaryThis report lists the total activity for each day of the week, summed over all the weeks in the report.
Each unit ( day: reqs: %reqs: pages: %pages: Tbytes: %bytes: ---: ------: ------: -----: ------: ------: ------: Sun: 451880: 14.71%: 13767: 48.23%: 1.26: 16.12%: Hourly SummaryThis report lists the total activity for each hour of the day, summed over all the days in the report.
Each unit ( hour: reqs: %reqs: pages: %pages: Gbytes: %bytes: ----: ------: ------: -----: ------: ------: ------: 0: 105120: 3.42%: 169: 0.59%: 313.43: 3.91%: Domain ReportThis report lists the countries of the computers which requested files. Listing domains, sorted by the amount of traffic. reqs: %bytes: domain -------: ------: ------ 3072650: 100%: [unresolved numerical addresses] Organisation ReportThis report lists the organisations of the computers which requested files.
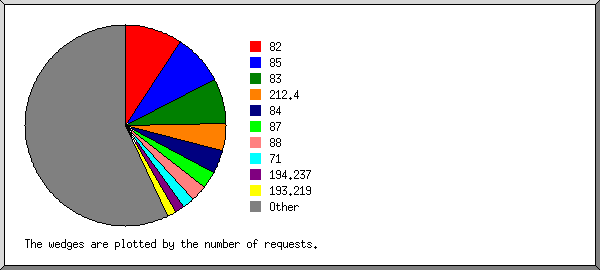
Listing the top 20 organisations by the number of requests, sorted by the number of requests. reqs: %bytes: organisation -------: ------: ------------ 287740: 3.48%: 82 246728: 8.43%: 85 224279: 7.31%: 83 131100: 13.47%: 212.4 115920: 11.93%: 84 81360: 1.67%: 87 79655: 2.00%: 88 61369: 1.01%: 71 48413: 0.50%: 194.237 43975: 1.24%: 193.219 39742: 1.46%: 90 35870: 1.53%: 89 33400: 0.81%: 91 30366: : 80.152 25067: 0.43%: 81.233 24707: 0.50%: 130.240 23273: 0.82%: 86 21819: 0.46%: 80.90 20894: 1.19%: 213.112 18724: 0.49%: 81.216 1478249: 41.27%: [not listed: 7,025 organisations] Host ReportThis report lists the computers which requested files.
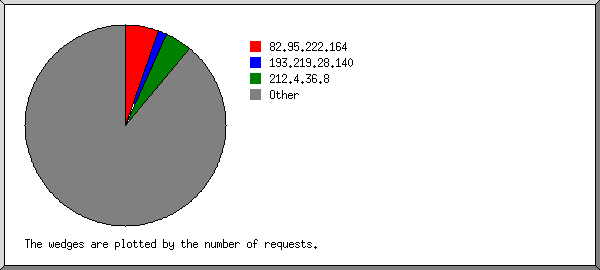
Listing the top 50 hosts by the number of requests, sorted alphabetically. reqs: %bytes: host -------: ------: ---- 16292: 0.29%: 62.140.212.3 14421: 0.23%: 69.254.89.148 17141: 0.22%: 71.162.124.154 23469: 0.30%: 71.162.124.164 14092: 0.01%: 71.226.248.202 8302: : 74.117.222.191 11003: 0.01%: 75.109.36.252 11165: 0.08%: 78.16.25.212 21804: 0.46%: 80.90.40.47 10042: 0.28%: 80.108.38.216 22814: : 80.152.155.155 7547: : 80.152.200.16 8415: 0.01%: 81.172.21.49 7840: 0.05%: 81.200.20.140 7865: 0.06%: 81.233.5.80 170861: 0.40%: 82.95.222.164 13962: 0.22%: 82.99.104.36 11736: 0.28%: 82.135.221.82 18397: 0.05%: 83.183.199.118 7525: 0.05%: 83.249.49.158 15436: 0.23%: 83.254.66.89 7541: 0.05%: 84.232.160.155 8775: 0.32%: 85.226.170.46 18573: 0.59%: 85.228.99.235 11617: 0.01%: 87.97.84.36 9692: 0.04%: 87.202.140.252 8379: 0.11%: 88.212.85.111 7967: 0.05%: 90.227.132.80 7960: 0.01%: 91.82.27.158 9818: 0.28%: 128.130.90.53 10060: 0.18%: 130.236.245.169 14765: 0.41%: 130.240.22.195 14216: 0.06%: 134.102.136.61 8623: 0.15%: 150.227.15.253 17940: 0.28%: 190.41.18.136 8508: 1.10%: 192.36.213.1 18191: 0.11%: 192.49.9.46 7677: 0.07%: 192.71.68.101 8327: 0.01%: 192.102.44.227 10645: 0.22%: 193.15.216.70 9108: 0.35%: 193.49.225.11 42214: 1.21%: 193.219.28.140 10484: 0.07%: 194.18.184.15 7891: 0.18%: 194.176.44.67 26559: 0.15%: 194.237.142.3 16727: 0.23%: 207.236.24.133 131096: 13.47%: 212.4.36.8 11055: 0.19%: 212.59.108.228 8546: 0.10%: 213.112.168.132 10941: 0.13%: 217.208.75.121 2148626: 76.64%: [not listed: 110,591 hosts] File Size ReportThis report lists the sizes of files.
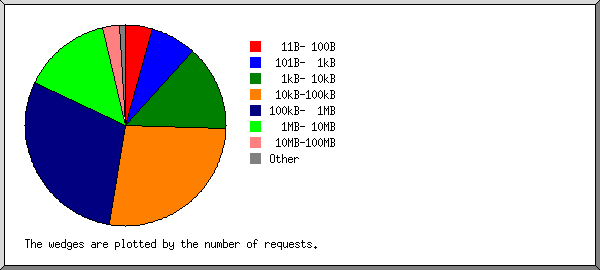
       size:   reqs: %bytes:
-----------: ------: ------:
          0:  12083:       :
   1B-  10B:    688:       :
  11B- 100B: 135448:       :
 101B-  1kB: 230444:       :
  1kB- 10kB: 421733:  0.02%:
 10kB-100kB: 826927:  0.44%:
100kB-  1MB: 905835:  3.81%:
  1MB- 10MB: 439322: 17.76%:
 10MB-100MB:  84843: 21.21%:
100MB-  1GB:  15220: 54.86%:
      > 1GB:    107:  1.91%:
File Type ReportThis report lists the extensions of files.
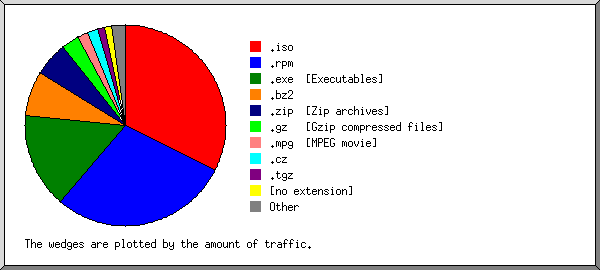
Listing extensions with at least 0.1% of the traffic, sorted by the amount of traffic. reqs: %bytes: extension ------: ------: --------- 7073: 32.19%: .iso 941489: 29.04%: .rpm 79496: 15.38%: .exe [Executables] 641962: 7.08%: .bz2 159110: 5.56%: .zip [Zip archives] 103938: 2.90%: .gz [Gzip compressed files] 56628: 1.89%: .tar.gz [Compressed archives] 3387: 0.40%: .list.gz 8691: 1.69%: .mpg [MPEG movie] 43072: 1.66%: .cz 46875: 1.23%: .tgz 267978: 1.05%: [no extension] 61459: 0.70%: .deb 80333: 0.32%: .lha 701: 0.20%: .img 1058: 0.16%: .dmg 15926: 0.14%: .hqx [Macintosh BinHex files] 613489: 0.69%: [not listed: 1,539 extensions] Directory ReportThis report lists the directories from which files were requested. (The figures for each directory include all of its subdirectories.) Listing directories with at least 0.01% of the traffic, sorted by the amount of traffic. reqs: %bytes: directory -------: ------: --------- 3072650: 100%: /ftp.sunet.se/ This analysis was produced by analog 6.0. (Go To: Top: General Summary: Yearly Report: Quarterly Report: Monthly Report: Weekly Report: Daily Report: Daily Summary: Hourly Summary: Domain Report: Organisation Report: Host Report: File Size Report: File Type Report: Directory Report) |
 ) represents 2,000 requests for pages or part thereof.


