Program started at Fri-26-Oct-2007 10:11. Analysed requests from Sat-01-Sep-2007 00:00 to Sun-30-Sep-2007 23:59 (30.00 days). (Go To: Top: General Summary: Monthly Report: Daily Summary: Hourly Summary: Organisation Report: Status Code Report: File Size Report: File Type Report: Directory Report) General SummaryThis report contains overall statistics. (Figures in parentheses refer to the 7-day period ending 30-Sep-2007 23:59).
Monthly ReportThis report lists the activity in each month.
Each unit ( month: reqs: %reqs: pages: %pages: Tbytes: %bytes: --------: --------: ------: -------: ------: ------: ------: Sep 2007: 17266565: 100%: 1067597: 100%: 30.48: 100%:Busiest month: Sep 2007 (1,067,597 requests for pages). Daily SummaryThis report lists the total activity for each day of the week, summed over all the weeks in the report.
Each unit ( day: reqs: %reqs: pages: %pages: Tbytes: %bytes: ---: -------: ------: ------: ------: ------: ------: Sun: 2713219: 15.71%: 178627: 16.73%: 5.82: 19.10%: Hourly SummaryThis report lists the total activity for each hour of the day, summed over all the days in the report.
Each unit ( hour: reqs: %reqs: pages: %pages: Tbytes: %bytes: ----: ------: ------: -----: ------: ------: ------: 0: 638194: 3.70%: 53905: 5.05%: 1.12: 3.67%: Organisation ReportThis report lists the organisations of the computers which requested files.
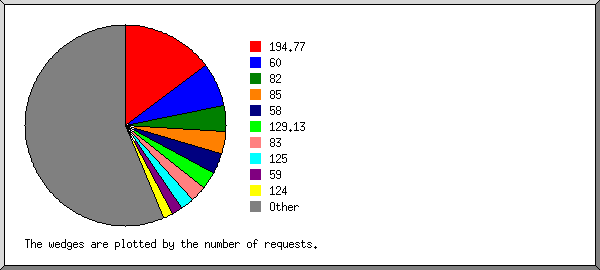
Listing the top 20 organisations by the number of requests, sorted by the number of requests. reqs: %bytes: organisation -------: ------: ------------ 2735025: : 194.77 1211071: 0.54%: 60 733802: 4.83%: 82 610507: 6.35%: 85 573365: 0.69%: 58 469640: 0.01%: 129.13 451373: 7.76%: 83 343673: 0.45%: 125 301281: 0.36%: 59 267189: 0.41%: 124 234681: 5.81%: 84 219040: 0.22%: 121 210035: 0.81%: 74 203715: 0.02%: 65.55 193169: 3.37%: 88 171406: 4.00%: 87 171185: 0.18%: 123 166926: 3.11%: 89 148812: 0.01%: 81.93 147727: 0.10%: 138.246 7702943: 60.95%: [not listed: 10,527 organisations] Status Code ReportThis report lists the HTTP status codes of all requests.
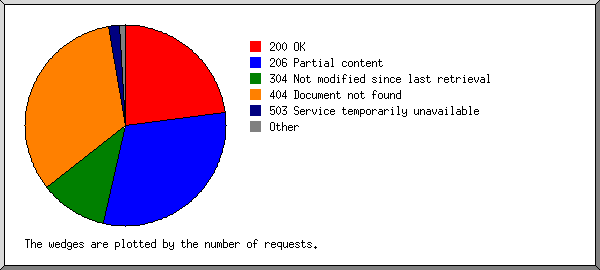
Listing status codes, sorted numerically. reqs: status code
-------: -----------
6251265: 200 OK
7902982: 206 Partial content
17975: 301 Document moved permanently
27748: 302 Document found elsewhere
3112318: 304 Not modified since last retrieval
48935: 400 Bad request
7483: 403 Access forbidden
9051596: 404 Document not found
10102: 405 Method not allowed
1: 406 Document not acceptable to client
10: 412 Precondition failed
69483: 416 Requested range not valid
13: 500 Internal server error
15: 501 Request type not supported
527158: 503 Service temporarily unavailable
File Size ReportThis report lists the sizes of files.
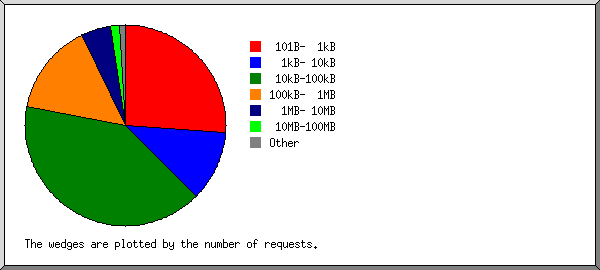
       size:    reqs: %bytes:
-----------: -------: ------:
          0:   81693:       :
   1B-  10B:      61:       :
  11B- 100B:   21042:       :
 101B-  1kB: 4709034:       :
  1kB- 10kB: 1969799:  0.03%:
 10kB-100kB: 6833697:  1.36%:
100kB-  1MB: 2526119:  2.11%:
  1MB- 10MB:  808917:  7.35%:
 10MB-100MB:  258054: 21.81%:
100MB-  1GB:   56486: 51.69%:
      > 1GB:    1663: 15.65%:
File Type ReportThis report lists the extensions of files.
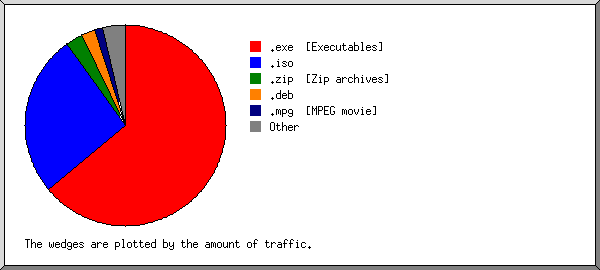
Listing extensions with at least 0.1% of the traffic, sorted by the amount of traffic. reqs: %bytes: extension -------: ------: --------- 5950474: 63.99%: .exe [Executables] 1326359: 26.04%: .iso 784230: 2.75%: .zip [Zip archives] 536417: 2.20%: .deb 56905: 1.36%: .mpg [MPEG movie] 33165: 0.88%: .dmg 150861: 0.67%: .wmv 2281543: 0.64%: .gz [Gzip compressed files] 758779: 0.54%: .tar.gz [Compressed archives] 124892: 0.35%: .rpm 141127: 0.18%: .mp3 [MP3 sound files] 175535: 0.17%: .bz2 194395: 0.15%: .lha 1760896: 0.10%: [no extension] 3749765: 0.51%: [not listed: 3,633 extensions] Directory ReportThis report lists the directories from which files were requested. (The figures for each directory include all of its subdirectories.)
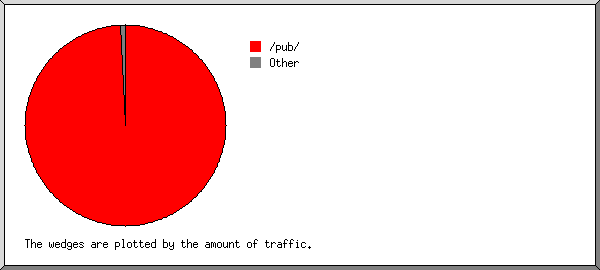
Listing directories with at least 0.01% of the traffic, sorted by the amount of traffic. reqs: %bytes: directory
--------: ------: ---------
15759638: 99.18%: /pub/
17704: 0.28%: /files/
148614: 0.10%: /driver/
1635: 0.07%: /files5/
1881: 0.06%: /files1/
16131: 0.06%: /mods/
1283: 0.04%: /files7/
1980: 0.04%: /files4/
2898: 0.03%: /files2/
2099: 0.02%: /files3/
5023: 0.02%: /game/
11653: 0.01%: /demo/
10855: 0.01%: /pix/
1086: 0.01%: /files6/
1284084: 0.06%: [not listed: 122 directories]
This analysis was produced by analog 6.0. Running time: 17 minutes, 7 seconds. (Go To: Top: General Summary: Monthly Report: Daily Summary: Hourly Summary: Organisation Report: Status Code Report: File Size Report: File Type Report: Directory Report) |
 ) represents 80,000 requests for pages or part thereof.


