Program started at Mon-17-Dec-2007 17:24. Analysed requests from Thu-01-Nov-2007 00:00 to Fri-30-Nov-2007 23:59 (30.00 days). (Go To: Top: General Summary: Monthly Report: Daily Summary: Hourly Summary: Organisation Report: Status Code Report: File Size Report: File Type Report: Directory Report) General SummaryThis report contains overall statistics. (Figures in parentheses refer to the 7-day period ending 30-Nov-2007 23:59).
Monthly ReportThis report lists the activity in each month.
Each unit ( month: reqs: %reqs: pages: %pages: Tbytes: %bytes: --------: --------: ------: -------: ------: ------: ------: Nov 2007: 22641025: 100%: 1170319: 100%: 45.35: 100%:Busiest month: Nov 2007 (1,170,319 requests for pages). Daily SummaryThis report lists the total activity for each day of the week, summed over all the weeks in the report.
Each unit ( day: reqs: %reqs: pages: %pages: Tbytes: %bytes: ---: -------: ------: ------: ------: ------: ------: Sun: 2848570: 12.58%: 137234: 11.73%: 6.11: 13.47%: Hourly SummaryThis report lists the total activity for each hour of the day, summed over all the days in the report.
Each unit ( hour: reqs: %reqs: pages: %pages: Tbytes: %bytes: ----: -------: ------: -----: ------: ------: ------: 0: 589861: 2.61%: 58306: 4.98%: 1.62: 3.58%: Organisation ReportThis report lists the organisations of the computers which requested files.
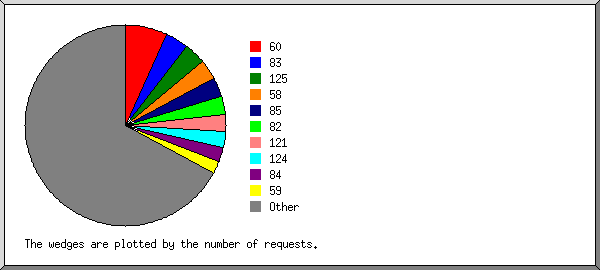
Listing the top 20 organisations by the number of requests, sorted by the number of requests. reqs: %bytes: organisation --------: ------: ------------ 1578852: 0.70%: 60 843430: 7.33%: 83 761787: 0.55%: 125 741072: 0.53%: 58 713130: 5.94%: 85 666544: 4.53%: 82 597392: 0.33%: 121 575492: 0.49%: 124 527953: 5.43%: 84 452307: 0.56%: 59 434860: 0.25%: 123 382820: 0.01%: 129.13 327721: 3.81%: 87 310041: 2.99%: 88 296172: 3.10%: 89 278327: 2.59%: 90 236530: 0.13%: 116 207511: 0.03%: 66.249 207102: 0.58%: 74 191857: 0.71%: 70 12310125: 59.42%: [not listed: 10,970 organisations] Status Code ReportThis report lists the HTTP status codes of all requests.
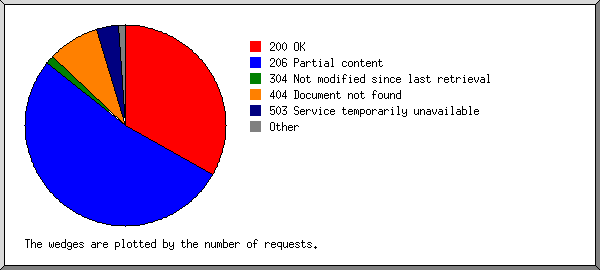
Listing status codes, sorted numerically. reqs: status code
--------: -----------
8637589: 200 OK
13626566: 206 Partial content
15722: 301 Document moved permanently
25894: 302 Document found elsewhere
376870: 304 Not modified since last retrieval
143171: 400 Bad request
26486: 403 Access forbidden
2184512: 404 Document not found
8471: 405 Method not allowed
3: 406 Document not acceptable to client
2: 412 Precondition failed
70026: 416 Requested range not valid
14: 500 Internal server error
57: 501 Request type not supported
913329: 503 Service temporarily unavailable
File Size ReportThis report lists the sizes of files.
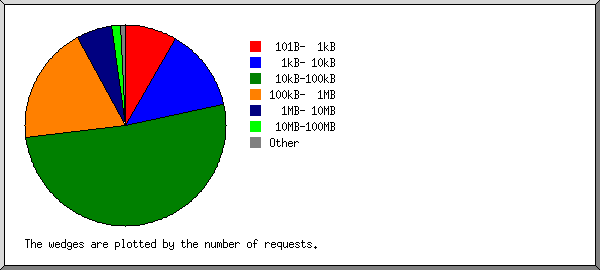
       size:     reqs: %bytes:
-----------: --------: ------:
          0:    46168:       :
   1B-  10B:      380:       :
  11B- 100B:    21347:       :
 101B-  1kB:  1890574:       :
  1kB- 10kB:  3029356:  0.03%:
 10kB-100kB: 11596066:  1.50%:
100kB-  1MB:  4324600:  2.43%:
  1MB- 10MB:  1294417:  7.76%:
 10MB-100MB:   339625: 20.33%:
100MB-  1GB:    95973: 52.28%:
      > 1GB:     2519: 15.67%:
File Type ReportThis report lists the extensions of files.
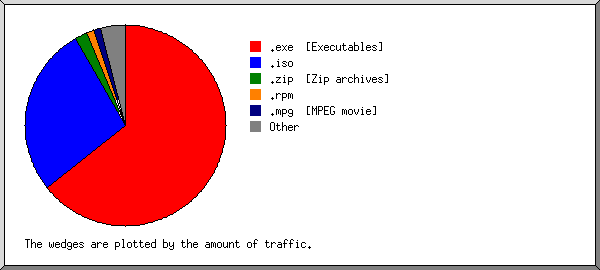
Listing extensions with at least 0.1% of the traffic, sorted by the amount of traffic. reqs: %bytes: extension --------: ------: --------- 11661845: 64.18%: .exe [Executables] 1296827: 27.55%: .iso 743767: 1.95%: .zip [Zip archives] 521196: 1.30%: .rpm 69609: 1.06%: .mpg [MPEG movie] 1223237: 0.92%: .gz [Gzip compressed files] 629331: 0.83%: .tar.gz [Compressed archives] 520206: 0.80%: .deb 33248: 0.76%: .dmg 77026: 0.49%: .msi 153132: 0.23%: .wmv 214396: 0.21%: .mp3 [MP3 sound files] 170567: 0.12%: .bz2 5955964: 0.44%: [not listed: 4,666 extensions] Directory ReportThis report lists the directories from which files were requested. (The figures for each directory include all of its subdirectories.)
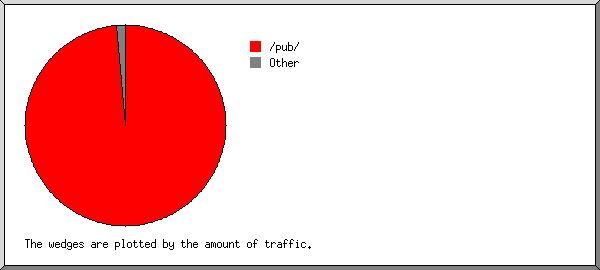
Listing directories with at least 0.01% of the traffic, sorted by the amount of traffic. reqs: %bytes: directory
--------: ------: ---------
20972714: 98.62%: /pub/
334505: 0.50%: http://
16433: 0.43%: /files/
3114: 0.18%: /files1/
1691: 0.11%: /files5/
13449: 0.04%: /mods/
10613: 0.02%: /pix/
546: 0.02%: /files7/
1287955: 0.08%: [not listed: 122 directories]
This analysis was produced by analog 6.0. Running time: 5 minutes, 7 seconds. (Go To: Top: General Summary: Monthly Report: Daily Summary: Hourly Summary: Organisation Report: Status Code Report: File Size Report: File Type Report: Directory Report) |
 ) represents 80,000 requests for pages or part thereof.


