Program started at Mon-03-Mar-2008 10:09. Analysed requests from Tue-01-Jan-2008 00:00 to Thu-31-Jan-2008 23:59 (31.00 days). (Go To: Top: General Summary: Monthly Report: Daily Summary: Hourly Summary: Organisation Report: Status Code Report: File Size Report: File Type Report: Directory Report) General SummaryThis report contains overall statistics. (Figures in parentheses refer to the 7-day period ending 31-Jan-2008 23:59).
Monthly ReportThis report lists the activity in each month.
Each unit ( month: reqs: %reqs: pages: %pages: Tbytes: %bytes: --------: --------: ------: -------: ------: ------: ------: Jan 2008: 27638637: 100%: 1310862: 100%: 46.86: 100%:Busiest month: Jan 2008 (1,310,862 requests for pages). Daily SummaryThis report lists the total activity for each day of the week, summed over all the weeks in the report.
Each unit ( day: reqs: %reqs: pages: %pages: Tbytes: %bytes: ---: -------: ------: ------: ------: ------: ------: Sun: 3649691: 13.21%: 185715: 14.17%: 6.35: 13.55%: Hourly SummaryThis report lists the total activity for each hour of the day, summed over all the days in the report.
Each unit ( hour: reqs: %reqs: pages: %pages: Tbytes: %bytes: ----: -------: ------: -----: ------: ------: ------: 0: 609856: 2.21%: 53509: 4.08%: 1.84: 3.93%: Organisation ReportThis report lists the organisations of the computers which requested files.
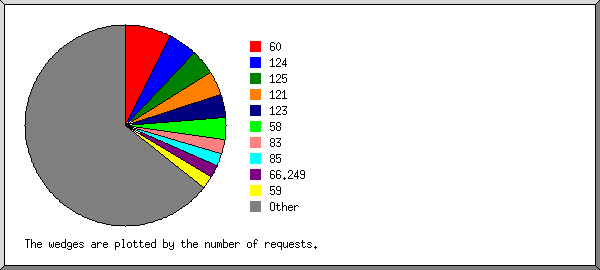
Listing the top 20 organisations by the number of requests, sorted by the number of requests. reqs: %bytes: organisation --------: ------: ------------ 2067149: 0.72%: 60 1297993: 0.56%: 124 1125584: 0.63%: 125 1066241: 0.43%: 121 1013788: 0.41%: 123 976750: 0.49%: 58 629737: 6.29%: 83 571558: 5.74%: 85 564776: 0.16%: 66.249 553306: 0.46%: 59 538892: 4.21%: 82 453860: 0.15%: 116 438757: 5.15%: 84 426258: 0.18%: 117 354762: 0.29%: 122 353704: 2.96%: 88 282091: 3.66%: 87 277416: 0.90%: 74 268337: 2.88%: 89 259057: 0.01%: 129.13 14118621: 63.73%: [not listed: 10,643 organisations] Status Code ReportThis report lists the HTTP status codes of all requests.
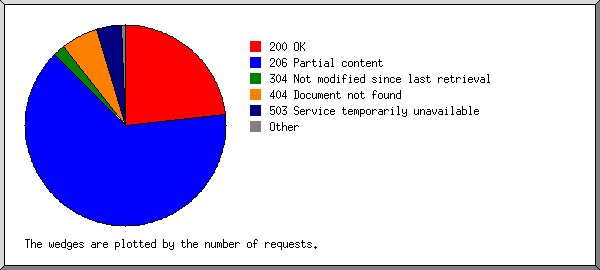
Listing status codes, sorted numerically. reqs: status code
--------: -----------
7188236: 200 OK
19839159: 206 Partial content
22967: 301 Document moved permanently
30930: 302 Document found elsewhere
611242: 304 Not modified since last retrieval
4045: 400 Bad request
49768: 403 Access forbidden
1824949: 404 Document not found
11509: 405 Method not allowed
48: 406 Document not acceptable to client
2: 412 Precondition failed
30110: 416 Requested range not valid
13: 500 Internal server error
14: 501 Request type not supported
1292836: 503 Service temporarily unavailable
File Size ReportThis report lists the sizes of files.
       size:     reqs: %bytes:
-----------: --------: ------:
          0:   267907:       :
   1B-  10B:      438:       :
  11B- 100B:    32628:       :
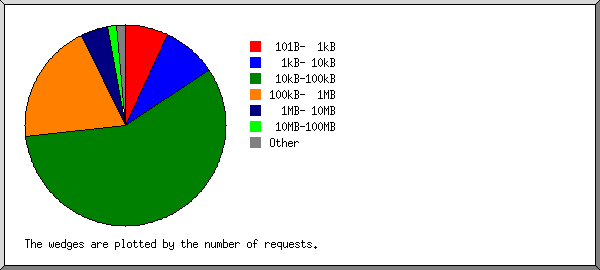
 101B-  1kB:  1924217:       :
  1kB- 10kB:  2429411:  0.02%:
 10kB-100kB: 15884673:  2.10%:
100kB-  1MB:  5398370:  2.82%:
  1MB- 10MB:  1240895:  7.37%:
 10MB-100MB:   375414: 20.64%:
100MB-  1GB:    82265: 51.78%:
      > 1GB:     2419: 15.26%:
File Type ReportThis report lists the extensions of files.
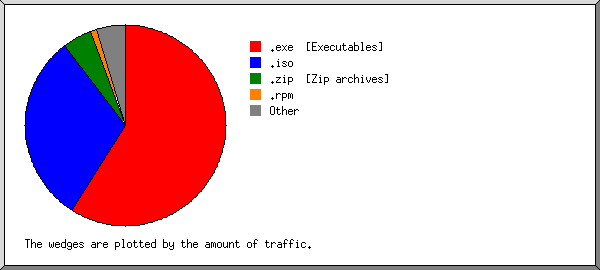
Listing extensions with at least 0.1% of the traffic, sorted by the amount of traffic. reqs: %bytes: extension --------: ------: --------- 17670453: 58.89%: .exe [Executables] 1825802: 30.75%: .iso 935597: 4.79%: .zip [Zip archives] 431408: 1.02%: .rpm 49227: 0.99%: .mpg [MPEG movie] 599438: 0.97%: .deb 29073: 0.88%: .dmg 740408: 0.49%: .gz [Gzip compressed files] 95705: 0.36%: .tar.gz [Compressed archives] 185781: 0.24%: .mp3 [MP3 sound files] 46488: 0.21%: .msi 108095: 0.18%: .wmv 134202: 0.12%: .bz2 4882665: 0.47%: [not listed: 6,094 extensions] Directory ReportThis report lists the directories from which files were requested. (The figures for each directory include all of its subdirectories.)
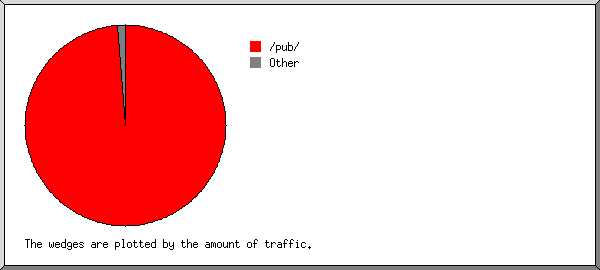
Listing directories with at least 0.01% of the traffic, sorted by the amount of traffic. reqs: %bytes: directory
--------: ------: ---------
25854920: 98.87%: /pub/
336117: 0.43%: http://
21265: 0.36%: /files/
2232: 0.08%: /files5/
44181: 0.07%: /mods/
1186: 0.06%: /files1/
1349: 0.02%: /files3/
434: 0.01%: /files7/
121382: 0.01%: /util/
11380: 0.01%: /pix/
1244191: 0.07%: [not listed: 123 directories]
This analysis was produced by analog 6.0. Running time: 11 minutes, 23 seconds. (Go To: Top: General Summary: Monthly Report: Daily Summary: Hourly Summary: Organisation Report: Status Code Report: File Size Report: File Type Report: Directory Report) |
 ) represents 100,000 requests for pages or part thereof.


