Program started at Mon-03-Mar-2008 09:37. Analysed requests from Fri-01-Feb-2008 00:00 to Fri-29-Feb-2008 23:59 (29.00 days). (Go To: Top: General Summary: Monthly Report: Daily Summary: Hourly Summary: Organisation Report: Status Code Report: File Size Report: File Type Report: Directory Report) General SummaryThis report contains overall statistics. (Figures in parentheses refer to the 7-day period ending 29-Feb-2008 23:59).
Monthly ReportThis report lists the activity in each month.
Each unit ( month: reqs: %reqs: pages: %pages: Tbytes: %bytes: --------: --------: ------: -------: ------: ------: ------: Feb 2008: 40744378: 100%: 1234070: 100%: 49.34: 100%:Busiest month: Feb 2008 (1,234,070 requests for pages). Daily SummaryThis report lists the total activity for each day of the week, summed over all the weeks in the report.
Each unit ( day: reqs: %reqs: pages: %pages: Tbytes: %bytes: ---: -------: ------: ------: ------: ------: ------: Sun: 5820792: 14.29%: 182937: 14.82%: 7.04: 14.27%: Hourly SummaryThis report lists the total activity for each hour of the day, summed over all the days in the report.
Each unit ( hour: reqs: %reqs: pages: %pages: Tbytes: %bytes: ----: -------: ------: -----: ------: ------: ------: 0: 662608: 1.63%: 42431: 3.44%: 1.55: 3.13%: Organisation ReportThis report lists the organisations of the computers which requested files.
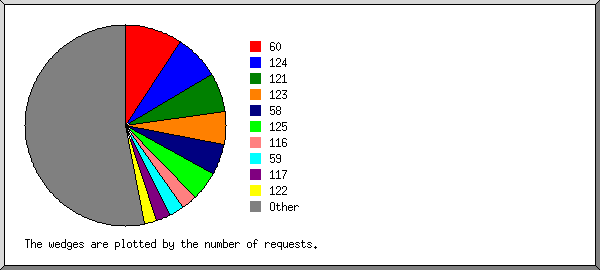
Listing the top 20 organisations by the number of requests, sorted by the number of requests. reqs: %bytes: organisation --------: ------: ------------ 3832596: 0.95%: 60 2921587: 0.80%: 124 2550184: 0.57%: 121 2149758: 0.49%: 123 1980666: 0.65%: 58 1918599: 0.96%: 125 1023868: 0.22%: 116 993024: 0.42%: 59 946517: 0.23%: 117 773646: 0.32%: 122 486538: 5.31%: 83 471097: 0.20%: 66.249 437440: 4.95%: 85 410937: 0.31%: 118 351114: 0.05%: 222.130 323018: 4.94%: 82 297526: 2.77%: 87 288025: 2.52%: 89 241512: 2.38%: 88 215984: 2.32%: 90 18130742: 68.64%: [not listed: 10,609 organisations] Status Code ReportThis report lists the HTTP status codes of all requests.
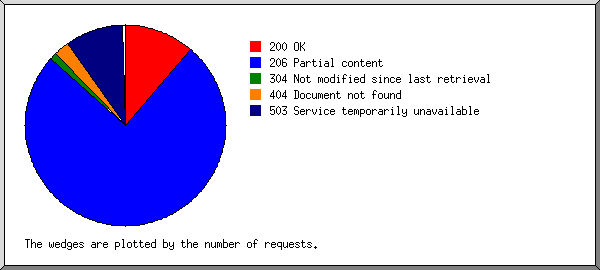
Listing status codes, sorted numerically. reqs: status code
--------: -----------
5258047: 200 OK
34965060: 206 Partial content
24113: 301 Document moved permanently
33556: 302 Document found elsewhere
521271: 304 Not modified since last retrieval
51552: 400 Bad request
68048: 403 Access forbidden
1152419: 404 Document not found
10772: 405 Method not allowed
44: 406 Document not acceptable to client
1: 412 Precondition failed
17860: 416 Requested range not valid
25: 500 Internal server error
30: 501 Request type not supported
4350837: 503 Service temporarily unavailable
File Size ReportThis report lists the sizes of files.
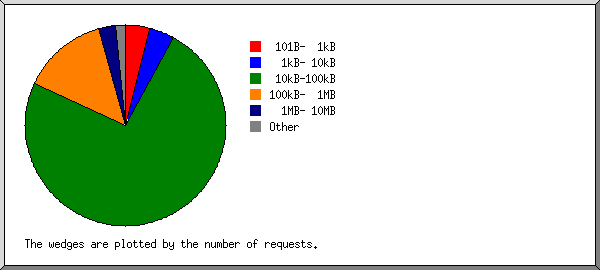
       size:     reqs: %bytes:
-----------: --------: ------:
          0:   208982:       :
   1B-  10B:      368:       :
  11B- 100B:    27651:       :
 101B-  1kB:  1621217:       :
  1kB- 10kB:  1689109:  0.01%:
 10kB-100kB: 30026482:  3.81%:
100kB-  1MB:  5655391:  2.59%:
  1MB- 10MB:  1107395:  6.28%:
 10MB-100MB:   320898: 17.36%:
100MB-  1GB:    85296: 60.21%:
      > 1GB:     1589:  9.73%:
File Type ReportThis report lists the extensions of files.
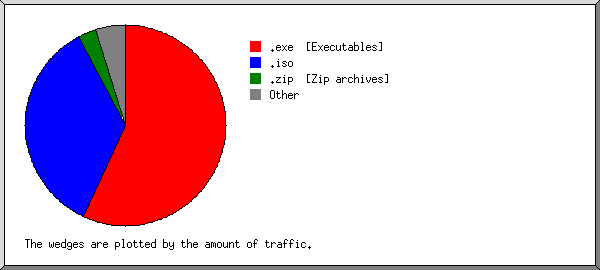
Listing extensions with at least 0.1% of the traffic, sorted by the amount of traffic. reqs: %bytes: extension --------: ------: --------- 31325274: 56.79%: .exe [Executables] 3175701: 35.52%: .iso 862911: 2.97%: .zip [Zip archives] 54324: 0.99%: .mpg [MPEG movie] 318457: 0.78%: .rpm 465295: 0.66%: .deb 32063: 0.58%: .dmg 577901: 0.39%: .gz [Gzip compressed files] 97191: 0.28%: .tar.gz [Compressed archives] 79427: 0.27%: .lha 102280: 0.21%: .msi 166910: 0.20%: .mp3 [MP3 sound files] 126400: 0.14%: .wmv 123845: 0.11%: .bz2 3333590: 0.38%: [not listed: 5,004 extensions] Directory ReportThis report lists the directories from which files were requested. (The figures for each directory include all of its subdirectories.)
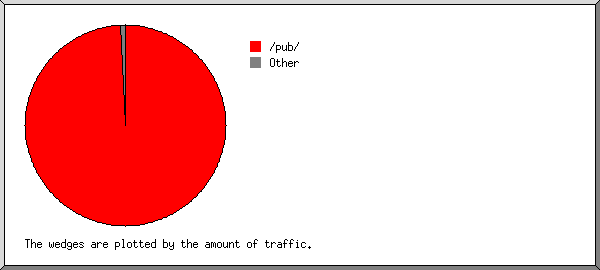
Listing directories with at least 0.01% of the traffic, sorted by the amount of traffic. reqs: %bytes: directory
--------: ------: ---------
39380796: 99.23%: /pub/
246139: 0.34%: http://
6638: 0.23%: /game/
17337: 0.06%: /files/
19684: 0.04%: /mods/
9660: 0.01%: /pix/
1064124: 0.08%: [not listed: 125 directories]
This analysis was produced by analog 6.0. Running time: 7 minutes, 53 seconds. (Go To: Top: General Summary: Monthly Report: Daily Summary: Hourly Summary: Organisation Report: Status Code Report: File Size Report: File Type Report: Directory Report) |
 ) represents 100,000 requests for pages or part thereof.


 Mon: 5451789: 13.38%: 154709: 12.54%: 5.21: 10.56%: