Program started at Mon-31-Mar-2008 10:54. Analysed requests from Sat-01-Mar-2008 00:00 to Mon-31-Mar-2008 00:00 (30.00 days). (Go To: Top: General Summary: Monthly Report: Daily Summary: Hourly Summary: Organisation Report: Status Code Report: File Size Report: File Type Report: Directory Report) General SummaryThis report contains overall statistics. (Figures in parentheses refer to the 7-day period ending 31-Mar-2008 23:59).
Monthly ReportThis report lists the activity in each month.
Each unit ( month: reqs: %reqs: pages: %pages: Tbytes: %bytes: --------: ---------: ------: -------: ------: ------: ------: Mar 2008: 110391112: 100%: 2369636: 100%: 97.14: 100%:Busiest month: Mar 2008 (2,369,636 requests for pages). Daily SummaryThis report lists the total activity for each day of the week, summed over all the weeks in the report.
Each unit ( day: reqs: %reqs: pages: %pages: Tbytes: %bytes: ---: --------: ------: ------: ------: ------: ------: Sun: 18660076: 16.90%: 347874: 14.68%: 17.92: 18.44%: Hourly SummaryThis report lists the total activity for each hour of the day, summed over all the days in the report.
Each unit ( hour: reqs: %reqs: pages: %pages: Tbytes: %bytes: ----: -------: ------: ------: ------: ------: ------: 0: 2360910: 2.14%: 110688: 4.67%: 3.20: 3.29%: Organisation ReportThis report lists the organisations of the computers which requested files.
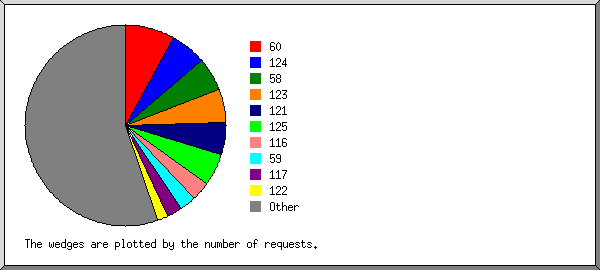
Listing the top 20 organisations by the number of requests, sorted by the number of requests. reqs: %bytes: organisation --------: ------: ------------ 8953438: 0.98%: 60 6214444: 1.05%: 124 5986374: 2.63%: 58 5983982: 0.69%: 123 5778326: 0.65%: 121 5612578: 3.92%: 125 3345956: 0.33%: 116 2913750: 0.50%: 59 2717788: 0.44%: 117 1852180: 0.31%: 122 1334820: 5.71%: 83 1178458: 4.90%: 85 1080322: 0.85%: 118 1032850: 3.83%: 82 844140: 1.89%: 77 839744: 3.91%: 84 839742: 3.14%: 87 813634: 2.86%: 89 786000: 0.13%: 66.249 777908: 2.62%: 88 51504678: 58.66%: [not listed: 11,920 organisations] Status Code ReportThis report lists the HTTP status codes of all requests.
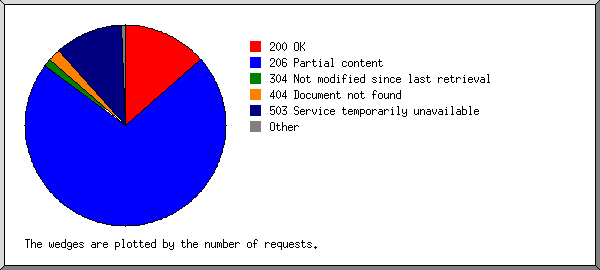
Listing status codes, sorted numerically. reqs: status code
--------: -----------
17380358: 200 OK
91433380: 206 Partial content
36976: 301 Document moved permanently
60510: 302 Document found elsewhere
1577374: 304 Not modified since last retrieval
471600: 400 Bad request
167230: 403 Access forbidden
2619848: 404 Document not found
22016: 405 Method not allowed
54: 412 Precondition failed
44518: 416 Requested range not valid
30: 500 Internal server error
50: 501 Request type not supported
14083850: 503 Service temporarily unavailable
File Size ReportThis report lists the sizes of files.
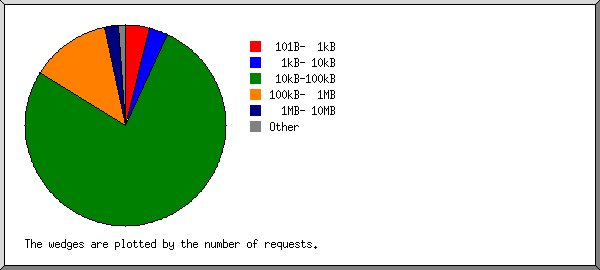
       size:     reqs: %bytes:
-----------: --------: ------:
          0:   358746:       :
   1B-  10B:      942:       :
  11B- 100B:    53774:       :
 101B-  1kB:  4267746:       :
  1kB- 10kB:  3405850:  0.01%:
 10kB-100kB: 84803688:  5.32%:
100kB-  1MB: 14206044:  3.16%:
  1MB- 10MB:  2504584:  7.00%:
 10MB-100MB:   635990: 18.63%:
100MB-  1GB:   149242: 52.00%:
      > 1GB:     4506: 13.88%:
File Type ReportThis report lists the extensions of files.
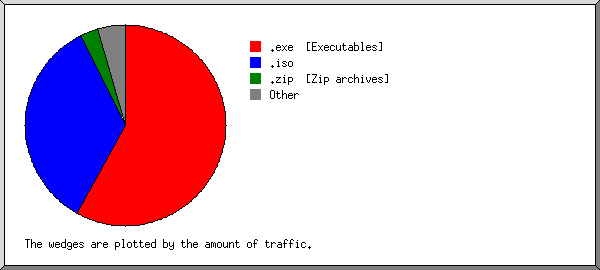
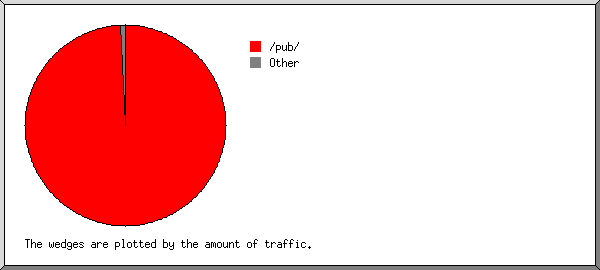
Listing extensions with at least 0.1% of the traffic, sorted by the amount of traffic. reqs: %bytes: extension --------: ------: --------- 67375124: 57.94%: .exe [Executables] 22338270: 34.71%: .iso 1979514: 2.90%: .zip [Zip archives] 126560: 0.86%: .mpg [MPEG movie] 796132: 0.82%: .rpm 942656: 0.70%: .deb 1244986: 0.41%: .gz [Gzip compressed files] 287020: 0.25%: .tar.gz [Compressed archives] 84268: 0.31%: .dmg 361956: 0.23%: .mp3 [MP3 sound files] 194818: 0.20%: .msi 5296040: 0.20%: .swf 385470: 0.15%: .wmv 2270916: 0.11%: .gif [GIF graphics] 273684: 0.10%: .bz2 6720718: 0.37%: [not listed: 5,668 extensions] Directory ReportThis report lists the directories from which files were requested. (The figures for each directory include all of its subdirectories.)
Listing directories with at least 0.01% of the traffic, sorted by the amount of traffic. reqs: %bytes: directory
---------: ------: ---------
107543426: 99.21%: /pub/
586468: 0.37%: http://
54096: 0.22%: /files/
41268: 0.06%: /mods/
15970: 0.02%: /pix/
5914: 0.02%: /files3/
2348: 0.01%: /files7/
8866: 0.01%: /game/
3244: 0.01%: /files1/
2129512: 0.07%: [not listed: 124 directories]
This analysis was produced by analog 6.0. Running time: 22 minutes, 46 seconds. (Go To: Top: General Summary: Monthly Report: Daily Summary: Hourly Summary: Organisation Report: Status Code Report: File Size Report: File Type Report: Directory Report) |
 ) represents 200,000 requests for pages or part thereof.


